199 results
High school statistics posters
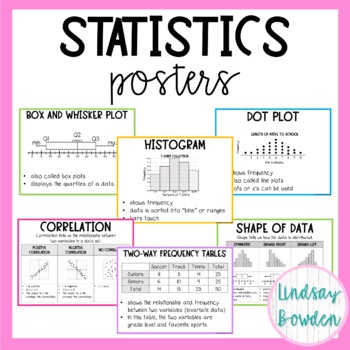
Statistics Posters (Algebra 1 Word Wall)
These statistics posters come with 18 posters on letter paper (8.5" by 11"). They are meant to be printed in color, but you can also print them in black and white.Posters include:box and whisker plots, histograms, stem and leaf, dot, plot, range, interquartile range, measures of central tendency, mean absolute deviation, shape of data, peaks in data, spread of data, scatter plots, correlation, causation vs. correlation, line of best fit, two-way frequency tables, standard deviation, normal dist
Subjects:
Grades:
8th - 10th
Also included in: Statistics Unit Bundle
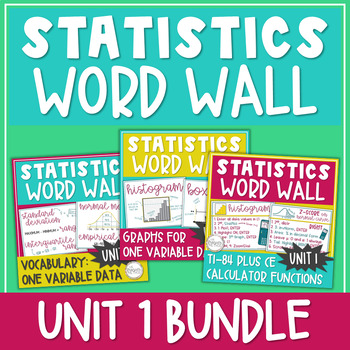
Statistics Word Wall / Statistics Posters / Math Bulletin Board Graphs & Charts
43 PAGES of Statistics Posters to add high school math classroom décor to your math bulletin board, math word wall, hallway, door, or as anchor charts with these 8.5" by 11" Statistics Word Wall Posters filled with STATISTICS GRAPHS, VOCABULARY, & TI-84 PLUS CE CALCULATOR FUNCTIONS! Definitions, formulas, graph features, and step-by-step calculator directions! Everything included in this bundle is from Unit 1: Exploring One-Variable Data in AP Statistics, and the information on each slide a
Subjects:
Grades:
10th - 12th
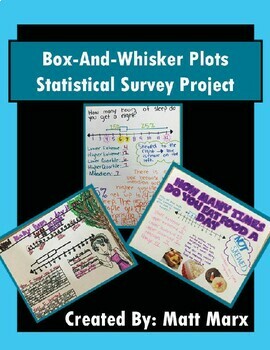
Box And Whisker Plots - Statistical Survey Project
Box-And-Whisker Plots - Statistical Survey ProjectThis Statistical Survey Project offers students the opportunity to demonstrate an understanding of Statistics content through the lens of a personalized statistical survey and the creation/study of a Box-And-Whisker Plot.Students insert themselves into their learning by selecting their own personalized survey question. Students have fun creating their posters, sharing them with the class, and having them displayed for all to see in the classroom.
Subjects:
Grades:
6th - 12th, Higher Education, Adult Education
Types:
CCSS:
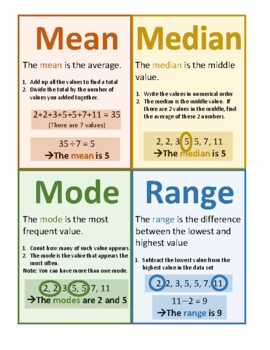
Mean Median Mode Range Poster Notes Anchor Chart
The PDF poster describes mean, median, mode, and range in an easy-to-understand and visual way. Enjoy!Check out my other posters here:STEM: Women in STEM Insp. Quotes, Women in STEM, Careers, Heroes Timeline, Inspirational Quotes from STEM HeroesABCs of Math: STEM Innovations, Amazing STEM facts, Careers, Shapes, in Nature Modern Style, in Nature Vintage Style, in Everyday LifeMath Vocabulary Alphabet: Elementary, Middle School, High SchoolMath in Art: Set A, Set B, Big BundleMath Modelling: Se
Subjects:
Grades:
5th - 9th
Types:
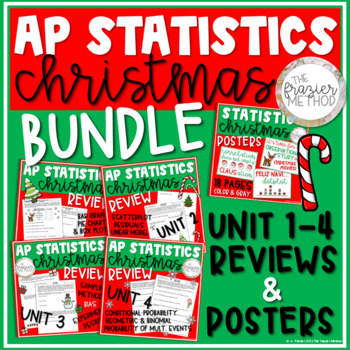
AP Statistics Christmas Posters & Reviews - Boxplot Scatterplot Probability Bias
AP Statistics Christmas Unit Reviews on box plots, bar graphs, scatterplots, linear models, residual plots, sampling methods, bias, experiment design, compound probability of multiple events, conditional probability, geometric & binomial distributions, and more! Use these four worksheets as a SUB PLAN, classwork the week before Christmas, homework over Christmas break, or quizzes when your students return from the holidays! The Statistics Christmas Posters will add fun holiday décor to your
Subjects:
Grades:
10th - 12th
Types:
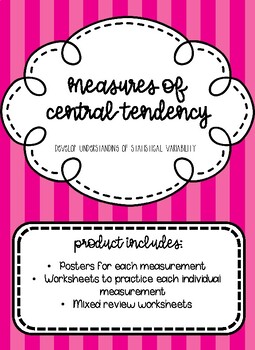
Finding Mean, Median, Mode, and Range
Simple worksheets (5 problems each) to introduce and practice finding the mean, median, mode, and range of a data set. Have students complete with or without calculator, depending on their instructional level. Product includes:-Reference posters for mean, median, mode, and range. Each poster includes the measures' definitions and directions for how to find them with an example.-5 worksheets about finding the mean.-5 worksheets about finding the median.-5 worksheets about finding the mode.-5 work
Subjects:
Grades:
1st - 12th
Types:
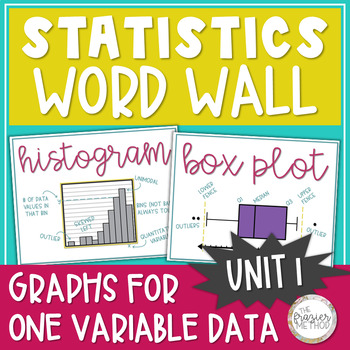
Statistics Word Wall Posters - Histogram, Box Plot, Bar Graph, Dot Plot Unit 1
Use these Statistics Posters to add high school math classroom decor to your bulletin board, hallway, math word wall, or classroom door with these great 8.5" by 11" Statistics Word Wall pages filled with statistics vocabulary, formulas, and graphs! All graphs are from Unit 1: Exploring One-Variable Data in AP Statistics, and the information on each slide aligns with AP College Board's objectives and standards for AP Statistics. ALL PAGES ARE IN COLOR & GRAYSCALE.Size: 8.5 by 11 inches[If you
Subjects:
Grades:
10th - 12th
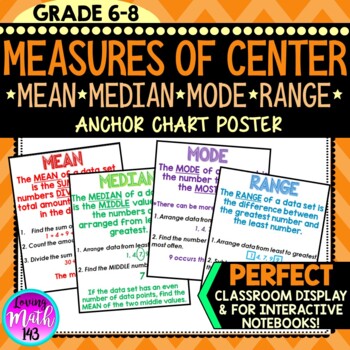
Mean, Median, Mode, Range Anchor Chart Poster
This middle school math anchor chart poster is a great tool to display in your classroom or distribute to your students to place in their interactive notebooks and/or binder. This anchor chart is great break down of mean, median, mode, and range. This anchor is aligned with the 6th and 7th grade Common Core standards students. GET THIS ANCHOR CHART BY PURCHASING MY MATH ANCHOR CHART BUNDLE! CHECK IT OUT HERE!***************************************************************************************
Subjects:
Grades:
6th - 10th
CCSS:
Also included in: 6th Grade Math Anchor Posters for the whole Year! {BUNDLE!}
Statistics In My World Project
This is a great project for students to do at the beginning of a HS statistics class. It will open their eyes to statistics in the media and provides real world interpretation of material learned the first couple weeks of class. The best part - You get lots of decorations for your wall and material to use as you progress through descriptive statistics!
Package includes instructions for teacher, including CCSM standards and objectives; student handout outlining specifics of the project; gradi
Subjects:
Grades:
11th - 12th
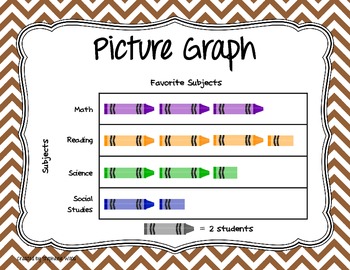
Types of Graphs Posters
Posters showing the various types of graphs for data display.
Includes:
Line Plot/Dot Plot
Line Graph
Bar Graph (Horizontal and Vertical)
Stem & Leaf Plot
Histogram
Box & Whisker Plot/Box Plot
Frequency Table
Circle Graph
Pictograph
Subjects:
Grades:
K - 12th, Higher Education, Adult Education
Types:
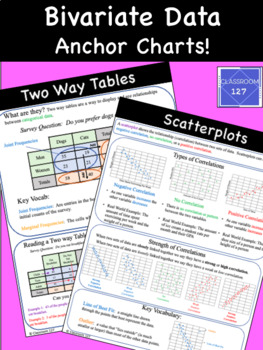
Bivariate Data Anchor Charts
This resource contains two different anchor charts to help students learn about bivariate data.To be more specific, the anchor charts help students to master the concepts of scatterplotstwo way tablesThis product also includes directions on how you can enlarge these anchor charts for free! Having the ability to see these charts from anywhere in the room has, in particular, really helped my ELL and SPED students master these challenging concepts.Possible uses for this product includeenlarge and u
Subjects:
Grades:
7th - 9th
Also included in: Anchor Charts Bundle
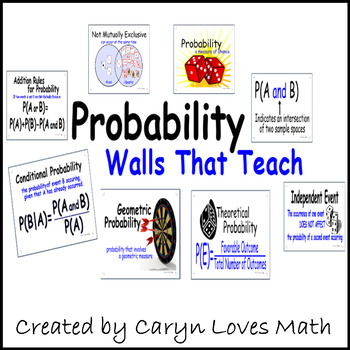
PROBABILITY- Vocabulary and Formulas Poster-Walls That Teach
25 Probability Walls that Teacher/Posters/Word Walls/ Vocabulary Words
25 8.5in by 10 in printable pages for your walls
Some of the words
-Probability
-Adding Probabilities
-AND
-OR
-Geometric Probability
-Mutually Exclusive
-
View the preview to see all the pages
Subjects:
Grades:
7th - 12th
Types:
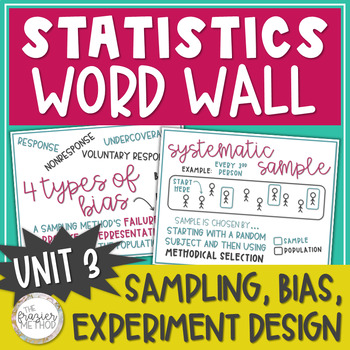
Statistics Word Wall Posters Sampling Methods, Bias, Experiment Design AP Unit 3
Use these Statistics Posters to add high school math classroom decor to your bulletin board, hallway, math word wall, or classroom door with these great 8.5" by 11" Statistics Word Wall pages of SAMPLING METHODS, TYPES OF BIAS, & EXPERIMENTAL DESIGN vocabulary! Put them up one at a time as you teach through each term or display them all at once. 34 PAGESALL PAGES ARE IN COLOR & GRAYSCALE.SIZE: 8.5 x 11 inches All vocabulary terms are from Unit 3: Collecting Data in AP Statistics, and the
Subjects:
Grades:
10th - 12th
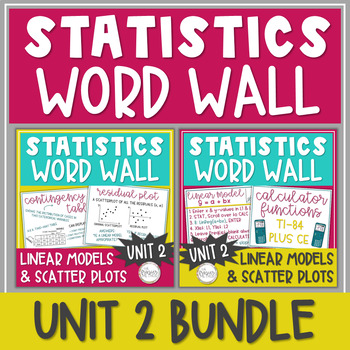
Statistics Word Wall Posters - Two-Way Table, Scatter Plot, Linear Model Unit 2
Use these Statistics Posters to add high school math classroom decor to your bulletin board, hallway, math word wall, or classroom door with these great 8.5" by 11" Statistics Word Wall pages filled with STATISTICS VOCABULARY, GRAPHS, & TI-84 CE CALCULATOR FUNCTIONS! 45 total pages of definitions, formulas, graph features, and step-by-step calculator processes! Put them up one at a time as you teach through the corresponding lessons or display them all at once. Everything included in this bu
Subjects:
Grades:
10th - 12th
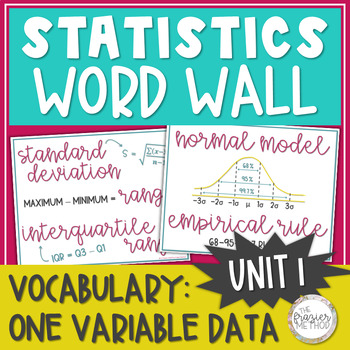
Statistics Word Wall Posters - Normal Model, Median, Mean, Skew, Z-Score Unit 1
Add some high school math classroom decor to your room or hallway with these great 8.5" by 11" statistics posters filled with statistics vocabulary, formulas, and graphs! These pages of AP Statistics decor can be displayed on any math word wall or math bulletin board! All vocabulary, formulas, and graphs are from Unit 1: Exploring One-Variable Data in AP Statistics, and the information on each slide aligns with AP College Board's objectives and standards for AP Statistics. ALL PAGES ARE IN COLOR
Subjects:
Grades:
10th - 12th
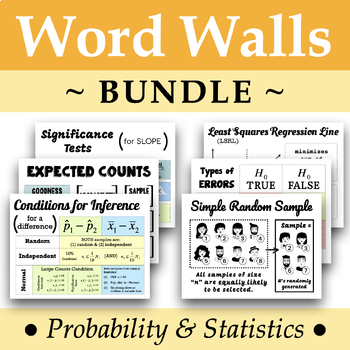
Statistic Word Wall BUNDLE
A bundle of the #1 to #12 Statistics Word Walls.
Subjects:
Grades:
9th - 12th
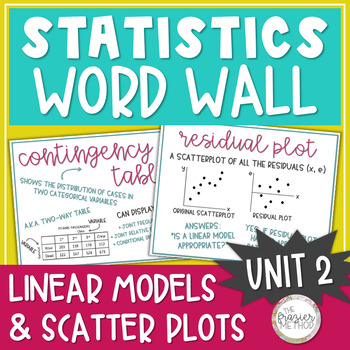
Statistics Word Wall Posters - Scatter Plot, Linear Model, Residual, Correlation
Use these Statistics Posters to add high school math classroom decor to your bulletin board, hallway, math word wall, or classroom door with these great 8.5" by 11" Statistics Word Wall pages filled with statistics vocabulary, formulas, and graphs! \Put them up one at a time as you teach through each term or display them all at once. All vocabulary, formulas, and graphs are from Unit 2: Exploring Two-Variable Data in AP Statistics, and the information on each slide aligns with AP College Board'
Subjects:
Grades:
10th - 12th, Higher Education
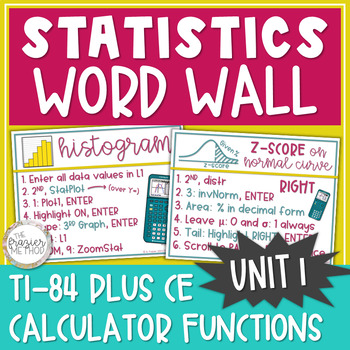
Statistics Word Wall Posters TI 84 Plus CE Calculator Box Plot Histogram Z-Score
Add high school math classroom decorations to your classroom bulletin board, hallway bulletin board, math word wall, or classroom door with these great 8.5" by 11" statistics posters filled with TI-84 CE CALCULATOR FUNCTIONS, such as graphing a histogram and boxplot, 5-Number Summary, area % under the Normal Model, and z-scores! All calculator functions are from Unit 1: Exploring One-Variable Data in AP Statistics, and the information on each slide aligns with AP College Board's objectives and s
Subjects:
Grades:
10th - 12th
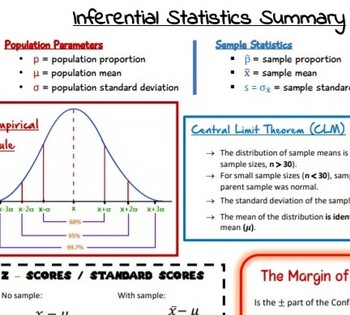
Inferential Statistics Summary
Included: complete PDFA summary of the notation and formulas for Higher Level Leaving Certificate Inferential Statistics:Empirical RuleCentral Limit TheoremZ / Standard ScoresMargin of ErrorConfidence IntervalHypothesis TestP Value
Subjects:
Grades:
11th - 12th, Higher Education
Types:
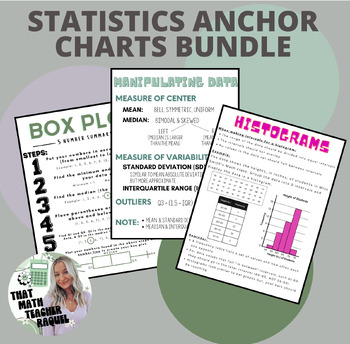
Statistics Anchor Chart Bundle
This Statistics Anchor Charts Bundle (including box plots, histograms, and manipulating data) can be referenced within your classroom while working on your one- and two-variable statistics unit. They are simple, easy to read, and have examples to follow along!There are various sizes for printing:• 8.5 x 11 in• 11 x 14 in• 12 x 18 in• 16 x 20 in• 25 x 30 in• 24 x 36 inI like to project the poster on to my board and trace onto chart paper. When I print my posters, I go to my local Walgreens! Other
Subjects:
Grades:
6th - 12th
Types:
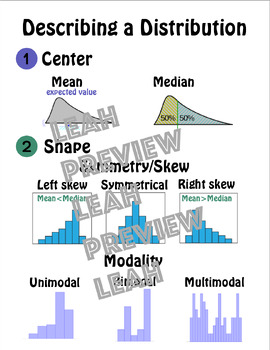
AP Statistics Word Wall Posters - Printer Friendly
Statistics can be overwhelming with all of the terminology and specifics. Make it easier for your students to understand with these colorful visuals, tailored to the AP Statistics curriculum. Included are 15 posters with the following concepts: describing a distribution (center; shape; variability - range, standard deviation, interquartile range; unusual features), population vs sample, parameter, statistic, standardized/z-score, normal distribution, empirical rule, standard normal table, least
Subjects:
Grades:
9th - 12th, Higher Education
Types:
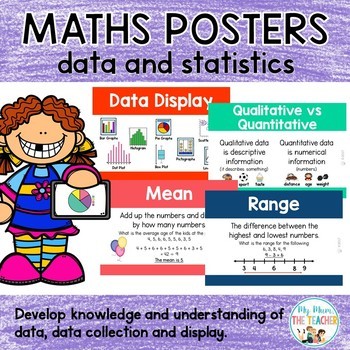
Data Analysis and Statistics Classroom Posters
This set of no-prep, printable Data & Statistics classroom posters, that include definitions & examples of Mean, Mode, Median & Range, will help students remember and understand what data is, how is can be collected and the different ways of displaying results. There are 10 posters:- What is Data?- Primary and Secondary Data- Data Display- Qualitative vs Quantatative- Discrete or Continuous- Census or Sample- Mean- Median- Mode- RangeHOW CAN YOU USE THIS PRODUCT?Print these off in A4
Subjects:
Grades:
6th - 10th
Types:
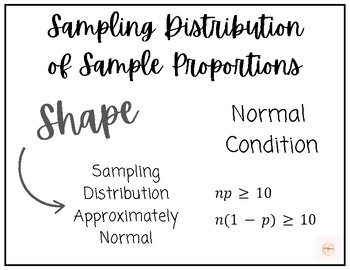
AP Statistics Unit 5 Word Wall Posters
AP Statistics Unit 5 Word Wall Posters
Subjects:
Grades:
11th - 12th
Types:

Math Posters Bundle
This is an excellent bundle of 41 Math Posters to reinforce learning and to create the right environment within the Mathematics classroom. The 41 Posters include: linear graphs, sequences, solving equations, pie charts, probability, averages, sets, stem & leaf, Pythagoras, basic trig, sohcahtoa, bearings, angle rules, transformations, circle theorems, area, volume, multiplication, pemdas, multiples, factors, prime factor trees, negative numbers, ratio, binomial Distribution, quadratic graphs
Subjects:
Grades:
6th - 9th
Types:
Showing 1-24 of 199 results

