596 results
High school statistics interactive notebooks
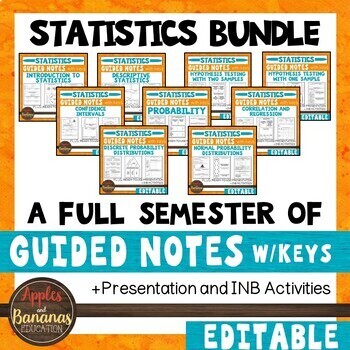
Statistics Interactive Notebook Activities & Guided Notes Bundle
These Statistics products are flexible, editable, and can be used for in-person or distance learning. Each unit contains guided notes embedded with student practice problems (keys included), foldable activities, and a PowerPoint presentation for focused instruction. Choose what works best for your class/student and modify to make the content fit your needs. Notes are designed to clearly present the topics and reach all types of learners. Take the time and stress out of creating your own guided n
Subjects:
Grades:
9th - 12th
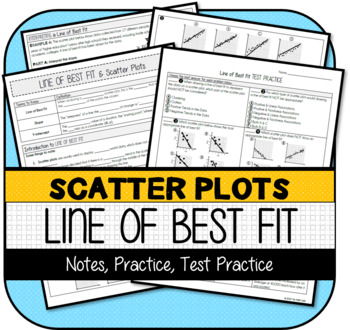
Scatter Plots: Line of Best Fit (NOTES & PRACTICE)
This resource was developed to meet the requirements of the 8th Grade Statistics & Probability standards below:CCSS.MATH.CONTENT.8.SP.A.2 Know that straight lines are widely used to model relationships between two quantitative variables. For scatter plots that suggest a linear association, informally fit a straight line, and informally assess the model fit by judging the closeness of the data points to the line.CCSS.MATH.CONTENT.8.SP.A.3 Use the equation of a linear model to solve problems i
Subjects:
Grades:
7th - 9th
Also included in: Scatter Plots MINI-BUNDLE
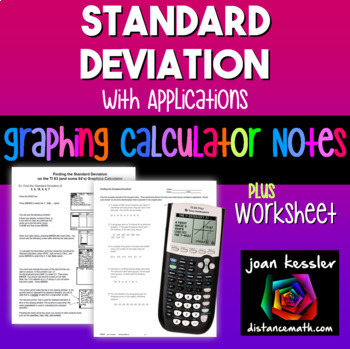
Standard Deviation on TI-84 Reference Sheets plus Practice
With this Determining the Standard Deviation on the TI 83 TI 84 Graphing Calculator plus HW step by step reference sheet your students will learn to use the graphing calculator effectively in finding the standard deviation from a data set. Use as Binder Notes or printed smaller for Interactive Notebooks.What's included?Two reference/handouts for students to learn how to find the Standard Deviation for both a population and for sample. One is for the TI 83 (yes, still in use) and the other for th
Subjects:
Grades:
8th - 11th
CCSS:
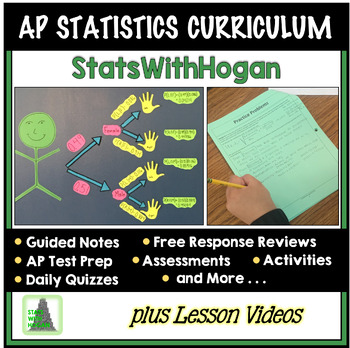
AP Statistics Curriculum Mega Bundle (with videos of each lesson)
This Bundle contains everything you will need to prepare your students for success on the AP® exam.I have designed these lessons over the past 12 years teaching AP Statistics. The organization and rigor of the lessons and practice have produced an AP pass rate well over the national average.I am redesigning the notes to make improvements including power point slides and keynote to present lessons. The upgrades will be free to those who have purchased this bundle. The curriculum was redesigned i
Subjects:
Grades:
9th - 12th, Higher Education
Types:
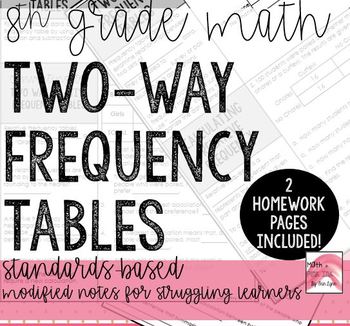
Two Way Frequency Tables and Relative Frequency Notes
NEW AND UPDATED FORMAT*
After careful study I am reformatting my notes to be easier to understand and be better resources for students. They will also more directly address the Common Core standards, and more specifically the Math Florida Standards (my home state).
I have designed this listing to directly address the listed standard for 8th grade, but it could be used in any grade covering frequency tables and relative frequency.
This PDF document contains:
1. Guided, two-column notes format
Subjects:
Grades:
8th - 10th
CCSS:
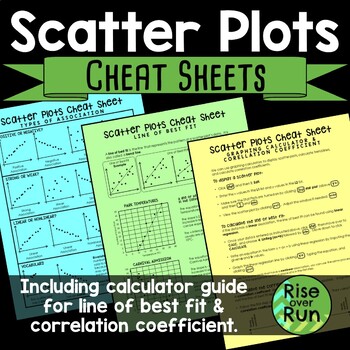
Scatter Plot Cheat Sheets Printable Guided Notes
Detailed sheets for the following topics: •Types of Association & VocabularyThis page shows examples of positive, negative, strong, weak, linear, and nonlinear association. It also shows clusters and outliers.•Line of Best FitThis page explains what a line of best is (or trend line) along with examples and nonexamples. It has 2 real world connections and how to interpret the line of best fit.•Graphing Calculator Guide & Correlation CoefficientThis sheet gives step by step instructions fo
Subjects:
Grades:
8th - 9th
CCSS:
Also included in: 8th Grade Math Activities & Lessons Bundle for the Whole Year
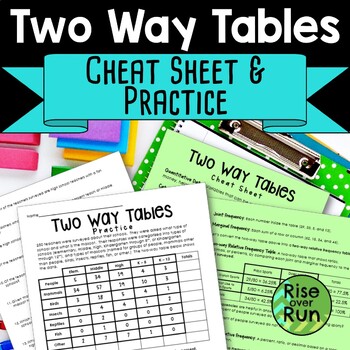
Two Way Frequency Tables Guided Notes and Practice Worksheet
Need an engaging way to get students learning about two way tables and bivariate data? This set of fill-in cheat sheets and practice helps students make sense of data and statistics represent in 2 way frequency tables. This set includes:Two Way Tables Cheat Sheets (2 Pages)These handouts have blanks to fill in with important vocabulary terms and examples of two way frequency tables. Questions are included too. This works great to fill out as a class to give students a solid foundation to und
Subjects:
Grades:
8th - 9th
CCSS:
Also included in: 8th Grade Math Activities & Lessons Bundle for the Whole Year
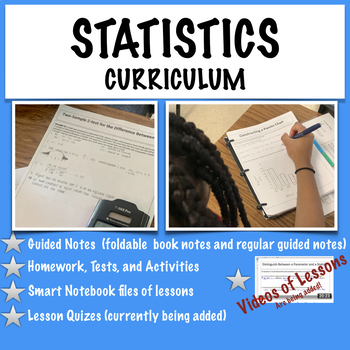
Statistics-Whole Curriculum (with videos of lessons)
This bundle will contain a whole curriculum for a introductory statistics course. The lessons are suitable for a college introductory course or a full year high school introductory statistics course.The bundle contains the following lessons: Unit 1: -Lesson 1: Introduction to Statistics -Lesson 2: Classifying Data -Lesson 3:Experimental Design Assignments/Activity/Quizzes for each lesson Pacing guide Test Unit 2: -Lesson 4:Frequency D
Subjects:
Grades:
9th - 12th, Higher Education
Types:
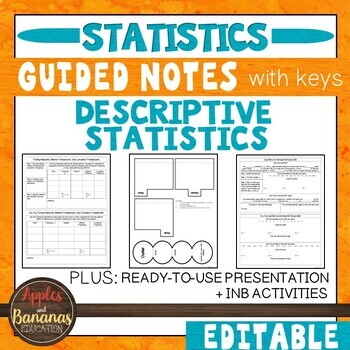
Descriptive Statistics- Guided Notes, Presentation, and INB Activities
This Introduction to Statistics product is flexible, editable, and can be used for in-person or distance learning. Take the time and stress out of creating your own guided notes and presentations. There are many ways to use this engaging bundle. It includes guided notes embedded with student practice problems (keys included), foldable activities, and a PowerPoint presentation for focused instruction. Choose what works best for your class/student and modify to make the content fit your needs. Not
Subjects:
Grades:
9th - 12th
CCSS:
Also included in: Custom Bundle for Viet
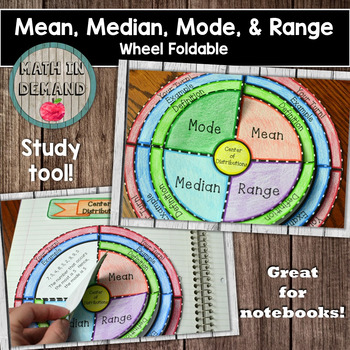
Mean, Median, Mode, and Range Wheel Foldable (Center of Distributions)
Students will construct a foldable on mean, median, mode, and range. There are 4 layers for the foldable: (1) Title, (2) Definition, (3) Example, and (4) Your Turn!. There is also a blank template included.
CLICK HERE to see my math foldables bundle!
CLICK HERE TO CHECK OUT MY VIDEO ON THIS FOLDABLE!
Subjects:
Grades:
5th - 9th
Also included in: Math Foldables Bundle (Includes All Math Wheel Foldables)
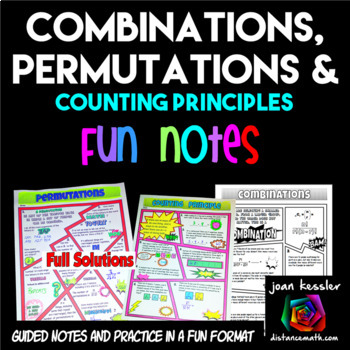
Permutations Combinations and Counting Principle FUN Notes Doodle Pages
Your students will love this Permutations, Combinations, and Counting Principle Fun Notes and Practice resource. Use it in class or as homework, assessment, or enrichment. A fun and engaging format for your students to learn the rules and practice their skills! Great for Algebra and Statistics.This resource contains 3 pages, one each for Permutations, Combinations, and the Fundamental Counting Principle. Students will complete a definitions and formula sections and complete over 20 problems.
Subjects:
Grades:
10th - 12th
CCSS:
Also included in: Algebra 2 FUN Notes Doodle Pages and Practice Bundle
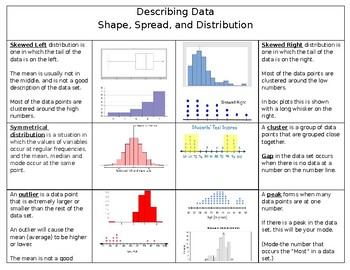
Describing Data based on shape, spread, and distribution
This is a quick foldable already put together for students to use as a reference when describing data based on its shape, spread, and distribution. It goes along with the 6th grade statistics standards.
When printing you should select two sided and print on short edge.
I got the idea from Bailey's corner, but I wanted to make a few changes. Here is the link to her store if you would like to check hers out.
https://www.teacherspayteachers.com/Product/Dot-Plots-and-Describing-the-Shape-of-Data-
Subjects:
Grades:
5th - 9th
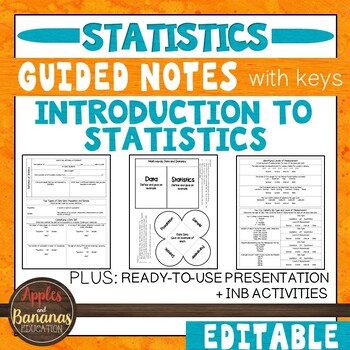
Introduction to Statistics - Guided Notes, Presentation, and INB Activities
This Introduction to Statistics product is flexible, editable, and can be used for in-person or distance learning. Take the time and stress out of creating your own guided notes and presentations. There are many ways to use this engaging bundle. It includes guided notes embedded with student practice problems (keys included), foldable activities, and a PowerPoint presentation for focused instruction. Choose what works best for your class/student and modify to make the content fit your needs. Not
Subjects:
Grades:
9th - 12th
CCSS:
Also included in: Custom Bundle for Viet
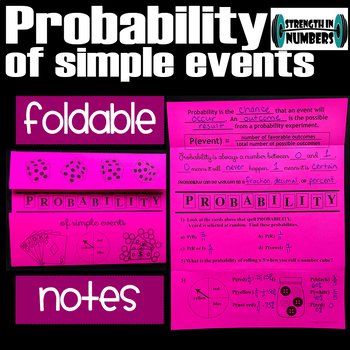
Simple Probability Foldable Notes for Interactive Notebook
Students love foldables for notes! This one covers the probability of simple events. These fit perfectly in a composition book for interactive notebooks or can be used on its own. Key included.Don't forget to earn TPT credits towards FREE products when you leave feedback! :)Try a FREE paper chain here!Try a FREE puzzle here!Check out my other PAPER CHAINS:One and Two Step InequalitiesEaster – Solving ProportionsBasketball - SlopeEaster Peeps – Order of OperationsArea and PerimeterBeach – Seven
Subjects:
Grades:
6th - 10th
Also included in: Complete BUNDLE of 50 Foldable Notes for Math 7
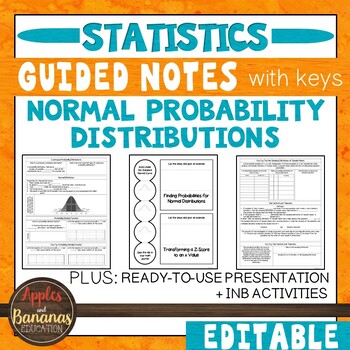
Normal Probability Distributions - Guided Notes, Presentation, + INB Activities
This Normal Probability Distributions (Statistics) product is flexible, editable, and can be used for in-person or distance learning. It includes guided notes embedded with student practice problems (keys included), foldable activities, and a PowerPoint presentation for focused instruction. Choose what works best for your class/student and modify to make the content fit your needs. Notes are designed to clearly present the topics and reach all types of learners. Take the time and stress out of c
Subjects:
Grades:
9th - 12th
CCSS:
Also included in: Custom Bundle for Viet
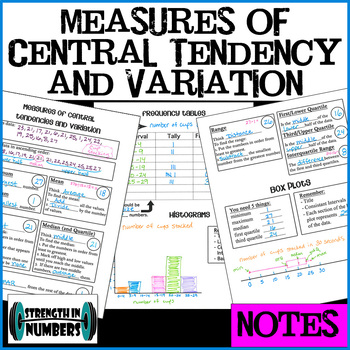
Interactive Notebook NOTES: Mean Median Mode Range Quartiles Box Plot Histogram
This set contains suggestions for student data collection and notes that use the data for measures of central tendencies and variation (mean, median, mode, range, first and third, quartiles, interquartile range, outliers), box plots, frequency tables, and histograms! Sounds like so much but these topics all go together so well. And by using data collected by students ABOUT students, they will be much more interested. This product contains ideas for collecting data, three full size (8.5x11) pa
Subjects:
Grades:
6th - 9th
Also included in: Complete BUNDLE of 50 Foldable Notes for Math 7
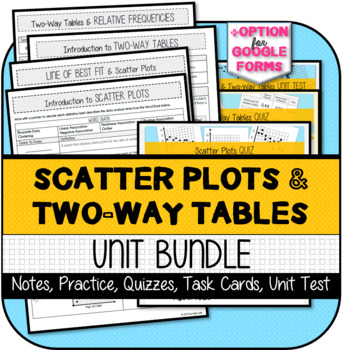
Scatter Plots & Two-Way Tables UNIT BUNDLE
NOTE: Google Apps Options - Only the ASSESSMENTS have Google Apps options. This unit is NOT ideal for "Distance Learning" unless you have special access to PDF editors that remove answer keys, etc.This resource was developed to meet the requirements of the 8th Grade Statistics & Probability Standards below:CCSS.MATH.CONTENT.8.SP.A.1 Construct and interpret scatter plots for bivariate measurement data to investigate patterns of association between two quantities. Describe patterns such as clu
Subjects:
Grades:
7th - 9th
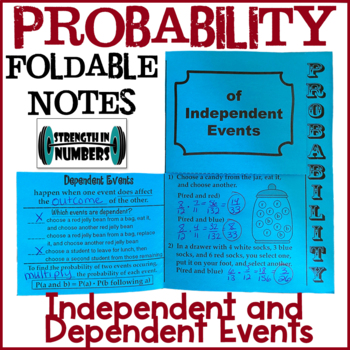
Probability Independent and Dependent Events Foldable Notes Interactive Notebook
Students love foldables for notes! This one covers the probability of independent and dependent events. Includes definitions, formulas, determining if events are dependent or independent and sample probability problems. Some of the practice problems are the same so you can talk with your students about how/why the answers are different when the events are dependent on each other. These fit perfectly in a composition book for interactive notebooks or can be used on its own. Key included.Don
Subjects:
Grades:
6th - 10th
Also included in: Complete BUNDLE of 50 Foldable Notes for Math 7
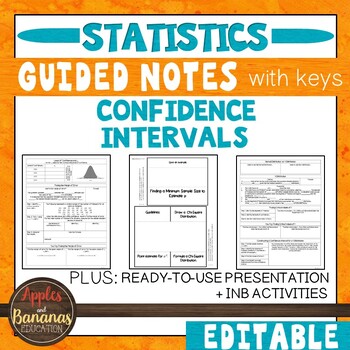
Confidence Intervals - Statistics Guided Notes, Presentation, +INB Activities
This Confidence Intervals (Statistics) product is flexible, editable, and can be used for in-person or distance learning. It includes guided notes embedded with student practice problems (keys included), foldable activities, and a PowerPoint presentation for focused instruction. Choose what works best for your class/student and modify to make the content fit your needs. Notes are designed to clearly present the topics and reach all types of learners. Take the time and stress out of creating your
Subjects:
Grades:
9th - 12th
CCSS:
Also included in: Custom Bundle for Viet
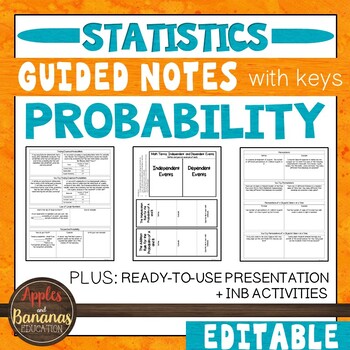
Probability - Guided Notes, Presentation, and Interactive Notebook Activities
This Probability (Statistics) product is flexible, editable, and can be used for in-person or distance learning. It includes guided notes embedded with student practice problems (keys included), foldable activities, and a PowerPoint presentation for focused instruction. Choose what works best for your class/student and modify to make the content fit your needs. Notes are designed to clearly present the topics and reach all types of learners. Take the time and stress out of creating your own guid
Subjects:
Grades:
9th - 12th
CCSS:
Also included in: Custom Bundle for Viet
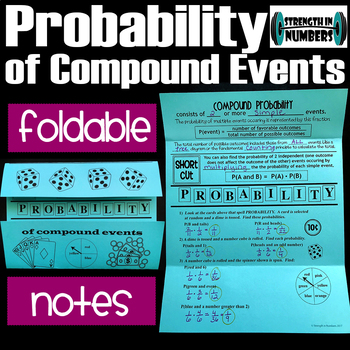
Probability of Compound Events Foldable Notes for Interactive Notebook
Students love foldables for notes! This one covers the probability of compound events. Gives the formula for finding probability and the shortcut of multiplying the probability of each independent event. These fit perfectly in a composition book for interactive notebooks or can be used on its own. Key included.Don't forget to earn TPT credits towards FREE products when you leave feedback! :)Try a FREE paper chain here!Try a FREE puzzle here!Check out my other PAPER CHAINS:One and Two Step In
Subjects:
Grades:
6th - 10th
Also included in: Complete BUNDLE of 50 Foldable Notes for Math 7
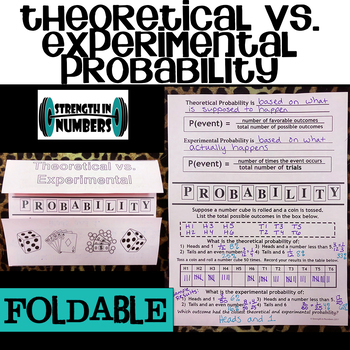
Theoretical vs. Experimental Probability Foldable Notes for Interactive Notebook
Students love foldables for notes! This one covers experimental and theoretical probability. It gives the definition of each and then students will figure out the number of outcomes possible when tossing a coin and rolling a die. They will figure out various theoretical probabilities for that. Then they will actually roll a die and toss a coin 50 times, record their results, figure out the same scenarios using experimental probability, and then compare the two. You will need dice and coins
Subjects:
Grades:
6th - 10th
Also included in: Complete BUNDLE of 50 Foldable Notes for Math 7
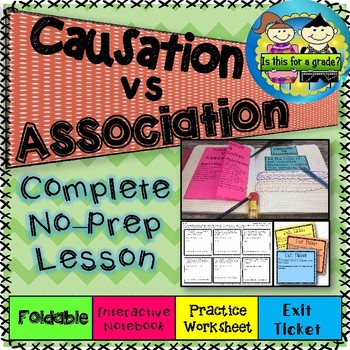
Causation vs Association (Correlation) Foldable, Activity, Practice, & Exit
Complete lesson, start to finish at your finger tips. The lesson introduces differentiating between causation vs association. The foldable is a great guided practice, the interactive notebook is a great way for students to collaborate and create and manipulate, the practice sheet can be used to reinforce, and I find exit tickets KEY to the assessment process. It allows me to see who has it and common misconceptions that I need to fix. What's Included:Foldable NotesInteractive Notebook ActivityPr
Subjects:
Grades:
8th - 12th
CCSS:
Also included in: Linear Functions Mega Bundle: No Prep Foldable Lessons
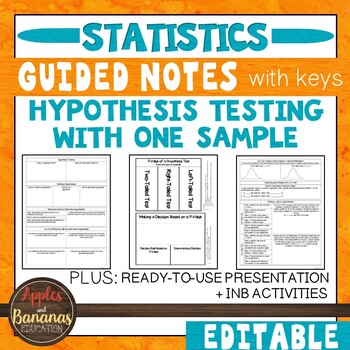
Hypothesis Testing with One Sample - Guided Notes, Presentation, +INB Activities
This Hypothesis Testing with One Sample (Statistics) product is flexible, editable, and can be used for in-person or distance learning. It includes guided notes embedded with student practice problems (keys included), foldable activities, and a PowerPoint presentation for focused instruction. Choose what works best for your class/student and modify to make the content fit your needs. Notes are designed to clearly present the topics and reach all types of learners. Take the time and stress out of
Subjects:
Grades:
9th - 12th
CCSS:
Also included in: Custom Bundle for Viet
Showing 1-24 of 596 results

