
Linear Regression and Correlation Digital plus Print with TI-84 notes


- PDF
- Google Apps™

What educators are saying
Also included in
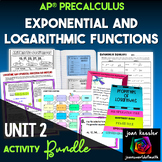 Are you looking for engaging activities to reinforce your AP® PreCalculus guided notes and lessons for Unit 2 Exponential and Logarithmic Functions? Teaching a new course is never easy, especially with no designated text, but teaching one that's hot off the press, that is a challenge. Whether you aPrice $54.75Original Price $84.25Save $29.50
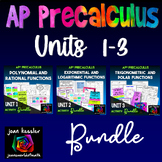 Are you looking for engaging activities to reinforce your AP® PreCalculus guided notes and lessons? Teaching a new course is never easy, especially with few designated texts. Engaging your students in a new course is also not easy. I have bundled AP® PreCalculus Units 1, 2, and 3 together at a deepPrice $150.00Original Price $252.35Save $102.35
 This Bundle of Digital Interactive Algebra 1 Activities for First Semester are engaging and make learning fun for your students. This is a great supplement to your Algebra 1 Curriculum, no matter which text or curriculum you use. Also included are printable versions for most of the activities. ThisPrice $49.50Original Price $76.00Save $26.50
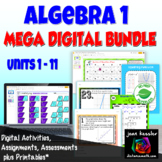 No matter which Algebra 1 Curriculum you use, this Mega Bundle of Interactive Digital Activities will engage all your students and make learning fun. The digital activities are Paperless and No Prep for you and will supplement your course. Many resources also include PDF printable versions and priPrice $199.95Original Price $303.64Save $103.69
 Since many teachers teach both Algebra 1 and Algebra 2 classes I have created this Mega Combo Bundle of Digital Activities which includes both theAlgebra 1 Mega Digital Bundle Activities for Google™ Drive and theAlgebra 2 MEGA Bundle of GOOGLE™ Activities Made for Google® Drive, the activities arePrice $299.00Original Price $490.64Save $191.64
Description
This Linear Regression and Correlation activity is a great way for your students to practice their skills. There are 12 well chosen representative problems. Digital and printable PDF versions included.
Questions include:
- Correlation
- Line of Best Fit
- Projecting Trends
- Find the linear regression from a table
- Find the linear regression from a scatter plot
- Determining the correlation coefficient
The editable digital self checking version can be used as an Quiz, HW, or Paperless worksheet and is designed with Google Forms™ which means it is NO PREP for you. The problems are a mix of free response and multiple choice.
A printable PDF version in Task Card Format is also included along with Guided notes on Using the TI-84 Graphing Calculator. The printable version has open ended questions.
Please zoom in on the preview to make sure these questions are appropriate for your classes.
Your download includes:
- PDF with links to the product.
- Detailed illustrated instructions on accessing and sharing the digital resource with your students
- Detailed illustrated instructions on editing and making multiple copies of the digital resource for your students
- 12 Digital Multiple choice problems
- A printable version of the problems in Task Card format
- Guided notes on using the graphing calculator to enter data and determine the regression equation and correlation coefficient
- Optional printable students response pages.
- Answer keys
✓ Note: You and your students must have a free Google account in order to access the activity, but need not be using Google Classroom™ to use this resource.
________________________________________________________
You may also like:
★ Linear Regression on the TI 83 84
★ Linear Regressions with Applications
★ Quadratic Regression Digital and Print Activity
★ Measures of Central Tendency, Mean, Median, Mode with GOOGLE Slides
★ Normal Distribution Digital Applications
★ Algebra 1 Bundle of Digital Activities
★ Algebra 2 MEGA Bundle of Digital Activities
_________________________________________________________
⇒ Please click here to follow my TpT store to hear about my freebies, sales, and new products. Did you know that you can earn 5% back towards future purchases by leaving feedback? Your feedback is greatly appreciated.
If you have any questions or comments please contact me by email me at: joan@joansworldofmath.com.
Connect with me:
✓ Sign up at Joan's World of Math to access my exclusive Free Resource Library
✓ Visit my Facebook Page
✓ Follow me on Instagram
LICENSING TERMS: The purchase of a license for this resource is for use by one teacher only for his or her students only. No part of this resource is to be shared with colleagues or used by an entire department, school, or district without purchasing the proper number of licenses. Please respect my hard work and do not share.
COPYRIGHT TERMS: ©2020-23 Joan Kessler (joansworldofmath.com™). This resource may not be uploaded to the internet in any form, including classroom/personal websites or network drives, unless the site is password protected and can only be accessed by students.
