660 results
High school statistics internet activities
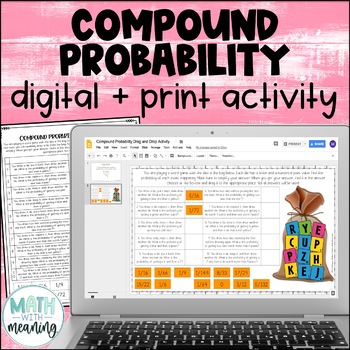
Compound Probability Digital and Print Activity for Google Drive and OneDrive
Looking for an engaging, no-prep activity to practice finding the probability of compound events? Students will use the included image to find the probability of 10 compound events, including both independent and dependent events. They will then find their answer from the answer choices at the bottom and drag it to the appropriate spot. Please view the preview file to make sure that this activity is appropriate for your students.This product includes the following:A link to the digital activity
Subjects:
Grades:
6th - 9th
CCSS:
Also included in: Middle School Math Digital and Print Activity Bundle Volume 1
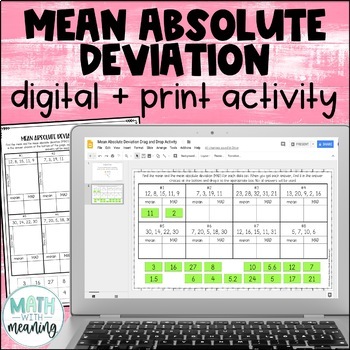
Mean Absolute Deviation MAD Digital and Print Activity for Google Drive
Looking for an engaging, no-prep activity to practice finding the MAD? Students will find the mean and mean absolute deviation for 8 data sets. They will then then find their answer from the answer choices at the bottom and drag it to the appropriate spot. Each data set contains 4-5 numbers. The mean of each data set is a whole number. Please view the preview file to make sure that these types of problems are appropriate for your students.This product includes the following:A link to the activit
Subjects:
Grades:
6th - 9th
CCSS:
Also included in: Middle School Math Digital and Print Activity Bundle Volume 2
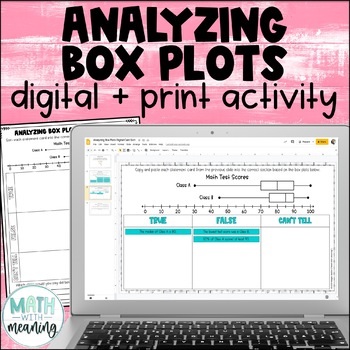
Box and Whisker Plot Digital and Print Card Sort - Reading and Analyzing
Looking for an engaging, no-prep activity to practice reading and analyzing box plots? Students will look at a double box plot and determine if statements about it are true, false, or if they can't tell from the information given in this fun digital and print activity.This activity includes statements about the minimum, maximum, median, quartile 1 (Q1), quartile 3 (Q3), interquartile range (IQR), and range of the box plots, along with statements about the percentages represented by a particular
Subjects:
Grades:
6th - 9th
Also included in: Middle School Math Digital and Print Activity Bundle Volume 3
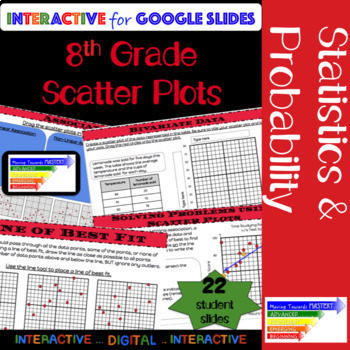
8th Grade Math Scatter Plot: Guided Interactive Lesson
Extensive ALL digital guided lesson for constructing and interpreting scatter plots.The slides are scaffolded to build understanding. Students will progress from identification of terms to making predictions involving bivariate data. The guided slides will begin with identification, move towards assisted analysis, and conclude with independent practice.Slides include...♦ Definitions and Visual Representations♦ Identification and Use of Terms→ Bivariate Data→ Scatter Plot→ Linear, Nonlinear, &
Subjects:
Grades:
8th - 10th
Types:
CCSS:
Also included in: 8th Grade Math Common Core Growing Bundle
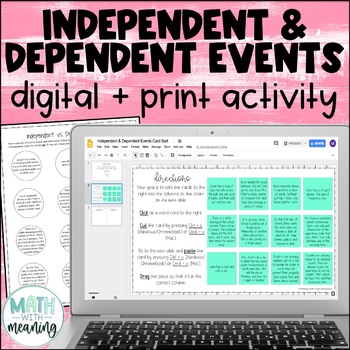
Independent and Dependent Events Digital Print Card Sort - Compound Probability
Looking for an engaging, no-prep activity to practice identifying independent and dependent events? Students will read 12 sets of compound events and determine if they are independent or dependent events. Many examples of real-world events are included. This is a great activity for students learning compound probability who struggle with differentiating between independent and dependent events. Also included is a printable graphic organizer that is perfectly sized for interactive notebooks. Plea
Subjects:
Grades:
6th - 9th
CCSS:
Also included in: Middle School Math Digital and Print Activity Bundle Volume 2
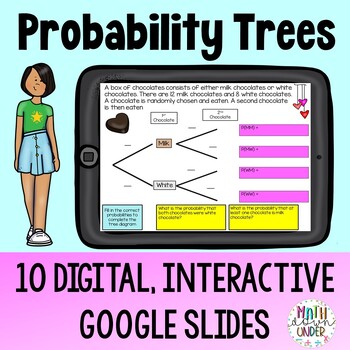
Probability Tree Diagrams Practice - Digital Activity using Google Slides
This resource is a set of 10 Google Slides that practices Probability Tree Diagrams. Complete with attractive graphics, students will solve compound probability problems (independent and dependent events included) by filling in the missing spaces on a probability tree. Starting with structured scaffolding, students are introduced to the process of creating probability trees by clicking and filling in the blanks on the Google Slide. This approach builds confidence and ensures students grasp the f
Subjects:
Grades:
6th - 9th
Also included in: Probability Tree Practice Bundle - PDF & Digital
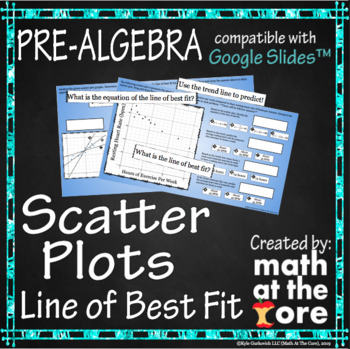
Scatter Plots - Line of Best Fit for Google Slides™
- Great for online and distance learning! Created to be compatible with Google Slides™!- In this digital activity, students will analyze scatter plots and determine the line of best fit. They will use the line of best fit and the equation of that line to predict values. They should be familiar with writing the equation of a line.- This activity includes 20 different problems involving analyzing scatter plots. Students will start with determining which line is the line of best fit for the given s
Subjects:
Grades:
7th - 9th
Types:
Also included in: Statistics - Unit 7 - BUNDLE for Google Slides™
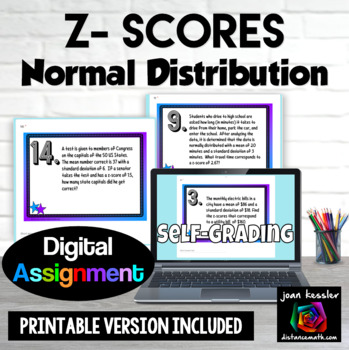
Normal Distribution Z-Scores Digital plus Print
Your students will get extra practice and gain fluency learning about z-scores and the Normal Distribution with both a self-grading digital resource and a PDF printable version. There are 16 applications to solve with a mix of multiple choice and free response including: finding the z-scorefinding the standard deviation knowing the z-score, mean, and data point finding the mean knowing the z-score, data point, and standard deviationinterpreting the z-score. Your download includes:PDF with link
Subjects:
Grades:
9th - 12th
Types:
CCSS:
Also included in: Probability and Statistics Algebra 2 Unit 11 Activity Bundle
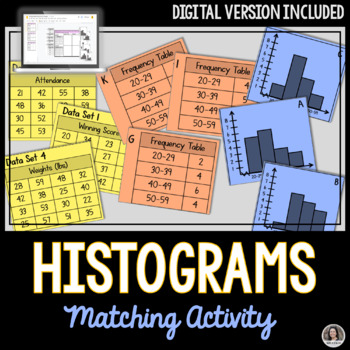
Histograms Matching Activity, Print and Digital Google Slides™
Practice makes perfect! This matching histograms activity is an ideal assignment for students to demonstrate their understanding of Histograms. Students match the data set to their corresponding frequency tables and histogram graphs. There will be 6 matches made when complete. Included:A pdf with a link to make a copy of the Interactive Google Slides™ for your own Google Drive™A printable version for students to sort and match.Student Response SheetAnswer keyDigital Version:Go paperless with thi
Subjects:
Grades:
7th - 12th
Types:

Measures of Center and Spread |Mean, Median, Standard Deviation, +|Google Forms™
Included in this Product: 100% Self-Grading Assessment or Homework using Google Forms™ - Measures of Center and Spread - Mean, Median, Range, Interquartile Range, Standard Deviation - 26 Questions each (9 multiple choice, 15 free response, and 2 checkbox). The default multiple choice answer order is generally set to be "shuffled" to prevent cheating. However, this can be edited. 2 similar versions for the price of 1!! Having a second version of the form allows for retakes and also gives you opt
Subjects:
Grades:
8th - 12th
Types:
CCSS:
Also included in: Algebra 2 Google Forms™
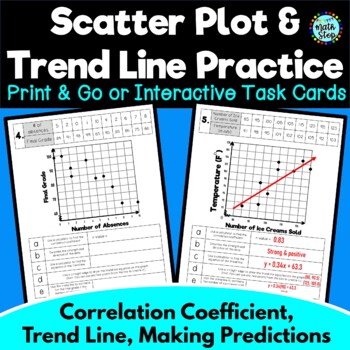
Scatter Plot Trend Line of Best Fit Correlation Coefficient Practice Task Cards
Students are given five different scatter plot scenarios (for example, temperature and the number of ice creams sold) with a table and graph already created. Their job is to use a calculator to find the correlation coefficient and equation of the line of best fit. Then for each one, they are asked to:➤ State the correlation coefficient/r-value.➤ Describe the strength and direction of the scatter plot.➤ Find the equation of the line of best fit/trend line.➤ Draw the line of best fit on the scatte
Subjects:
Grades:
7th - 10th
Types:
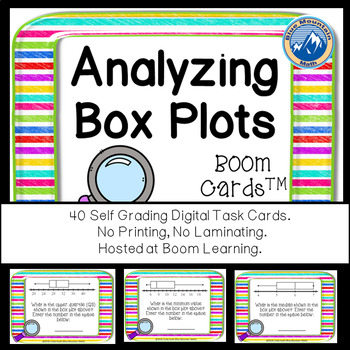
Analyzing Box Plots Boom Cards--Digital Task Cards
Boom Cards™ are a great way for students to practice skills analyzing Box Plots--formerly called Box and Whisker Plots. You can assess their understanding and students can play again to keep improving. This set uses a variety of different plots and asks question about lower quartile, upper quartile, median, interquartile range, range and outliers. This set of Boom Cards features 40 different Digital Self-Checking Task Cards. (No printing, cutting, laminating, or grading!)
Boom Cards live in the
Subjects:
Grades:
7th - 10th
Types:
CCSS:
Also included in: Algebra 1 Bundle Boom Cards--Digital Task Cards Distance Learning
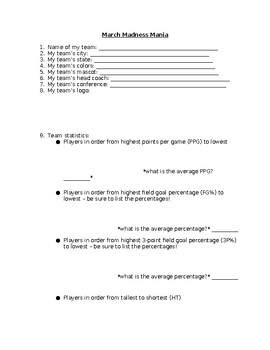
NCAA March Madness Basketball Tournament Team Research Statistics
Do you have students interested in the March Madness basketball tournament? Then this is the activity you need!To begin our March Madness unit, we look at all of the teams participating in the tournament and complete a map together to show where each team is from. We notice that some states have more than others and some states have none, and spend time discussing why that might be. Students will complete their own March Madness bracket.Students will then select a team in the NCAA March Madness
Grades:
4th - 9th
Types:

Statistics Confidence Intervals for the Mean Digital plus Print
Build your students' skills with this Confidence Intervals for the Mean Assignment in both digital and printable formats. The digital resource is designed with Google Forms™ which means it is NO PREP and the assignment will be graded automatically for you. The Printable version contains the same questions in a free response worksheet format.Topics Included:18 Task Cards for students to practice constructing confidence interval for the mean using the z - distribution and the t - distribution.Card
Subjects:
Grades:
10th - 12th, Higher Education
Types:
CCSS:
Measures of Central Tendency + Box Plots Digital Zombie Game for Google Slides
Your students will love this digital game using Google Slides that practices mean, median, mode, range, reading box plots, IQR, and more. The game is a fun adventure which has you in the middle of a Zombie Apocalypse! Students will solve various questions that involve data analysis (15 in total) to survive. For this resource, each student who will be completing the activity needs a Google account (although no sign in is required!) and Internet access. You will receive a link to the game to share
Subjects:
Grades:
6th - 10th
Types:
Also included in: 6th Grade Statistics Activity Bundle

Statistics Confidence Intervals for a Proportion Applications Digital and Print
Here is a great way to assess your students' skills with Confidence Intervals for a Proportion. This digital resource which can be used as a Quiz, HW, or Paperless worksheet is designed with Google Forms™ which means it is NO PREP and the assignment will be graded automatically for you. The pdf printable version is also incuded. There are 13 problems to solve, all applications. All questions ask for a confidence interval and one questions also asks for the margin of error and another the sampl
Subjects:
Grades:
9th - 12th
Types:
CCSS:
Interpreting Visual Displays of Data Bundle *Google Classroom* Distance Learning
This bundle will provide your students with practice interpreting data and finding central tendency. Includes activity for:Central TendencyInterpreting Dot PlotsInterpreting HistogramsInterpreting Frequency TablesInterpreting Box and Whisker Plots2 Ways to Assign Each Activity - I've included these resources as both a google form and google slides. When using the google form, students will type the answers into a google form quiz and it will grade it for you! When using the google slides, studen
Subjects:
Grades:
5th - 9th
Types:

Science Career Webquest: Chemist (chemistry / STEM / industry / sub plans)
CAREER WEBQUEST : CHEMISTSUBJECT: SCIENCE, CAREERS, CHEMISTRY, STEM, COMPUTERS, DISTANCE LEARNINGGRADES : 9-12DISTANCE LEARNING: YES!SUB PLANS: YES!This internet assignment is designed to be used with www.sciencebuddies.org. Full directions for students to link to the correct page career are provided with the webquest.Important: Please be aware that a FREE account with the website may be required in order for students to view all videos and information connected with this career. Teachers should
Subjects:
Grades:
9th - 12th
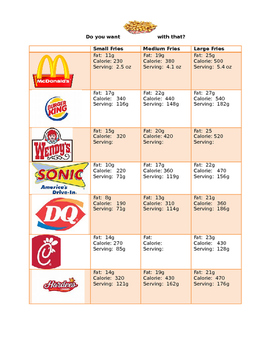
French Fry Scatter Plot & Best Line of Fit
Students will compare the nutritional values and serving sizes of french fries from various fast food restaurants. Based on this information, they will create scatter plots, best lines of fit and the equation of the trend line. Using the equation, they will estimate the unknown values of kid meals and supersized portions of french fries.
Subjects:
Grades:
8th - 11th
Types:
Box Plots Worksheet Activity Self Checking Pixel Art Box and Whisker Worksheet
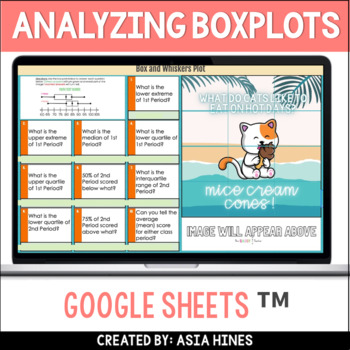
This NO PREP box and whisker plot worksheet is self-checking and includes a fun cat joke for your students! Tired of manually grading and checking your students' graphing practice? Let this google sheets activity will do the work for you!Works best with 7th and 8th-grade students.Topics Included:Analyzing BoxPlotsIncludes:Answer KeyGoogle Sheets Template with 10 Practice Problems and Pixel ArtPrintable EditionBenefits:The self-checking feature saves time and allows for more efficient practiceEng
Subjects:
Grades:
7th - 9th
CCSS:
Also included in: 8th Grade Math Activity - Ultimate Bundle
Bundle: Probability and Statistics COVID-19 Digital Activities (Common Core)
Bundle: Probability and Statistics COVID-19 Digital Activities (Common Core) This product is a bundle that includes 6 digital activities that were created in Google™ Slides. Each activity includes a background context relevant to COVID-19, summaries of real-world COVID-19 data derived from international or national health organizations or published research reports, detailed answer key, and instructions for accessing the activities. These activities are very challenging, focused on statistical
Subjects:
Grades:
9th - 12th
Types:
CCSS:
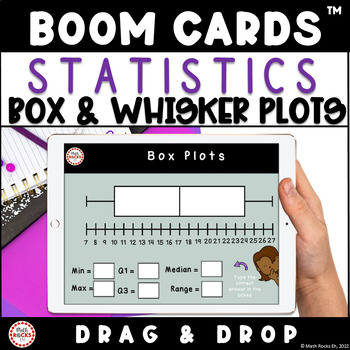
Box and Whisker Plots Activity Statistics Data Sets Math Digital Boom Cards™ 8th
Introduce your 8th grade students to box and whisker plots with this drag and drop and fill in the blanks digital Boom Cards activity. Students will analyze four sets of data drag and drop slides to review statistics terminology by placing the correct word or term in the space provided under the box whisker plot. Next, students will fill-in-the-blanks on six box-whisker plots by reading the number line to get the correct answer. Students will locate min, max, Q1, Q3, median and range.Aligns with
Subjects:
Grades:
6th - 9th
Types:
CCSS:
Also included in: MTH1W Grade 9 Math Activities Algebra 1 Digital Boom Cards™ MEGA Bundle
FBI Most Wanted AP Stat - Analyze Data, Normal Distributions, Linear Regression
I have created a series of activities for several units in the AP Statistics curriculum. The students love using data from fbi.gov to review concepts. This activity involves analyzing data related to the top 10 most wanted fugitives. I created this activity in May of 2020 and used the top 10 at that time. In the folder, you will find an editable slide of the top 10 if you want to change it.The answer key for the unit is based on the original top 10 that I used. Teachers have the option of having
Subjects:
Grades:
10th - 12th
Types:
CCSS:
Prob & Stats Population vs Sample using DIGITAL SELF CHECKING BOOM CARDS™
Probability and Statistics students will enjoy practicing identifying and classifying Populations and Samples with these fun and interactive digital Boom task cards! Students will be asked to determine the Population and the Sample for eight problem situations. Boom Cards are NO PREP required and SELF-CHECKING. I use Boom Cards with all of my classes and my students LOVE them. Boom Cards can be used as a synchronous whole group activity OR can be assigned to students to complete asynchronously f
Subjects:
Grades:
11th - 12th, Higher Education
Types:
Showing 1-24 of 660 results

