100 results
High school statistics research
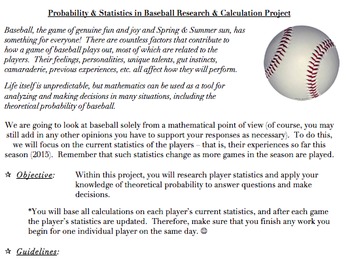
Probability & Statistics in Baseball Project (Common Core Aligned, AND FUN!)
The problems and activities within this document are designed to assist students in achieving the following standards: 6.SP.B.5, 7.SP.C, HSS.CP.A.2, HSS.CP.A.3, HSS.CP.B.7, HSS.CP.B.9, as well as the standards for mathematics practice and the literacy standards. They are also designed to help the teacher assess the students’ abilities when it comes to working with the ideas within the standards.This document contains the following:A project designed to allow students to investigate theoretical
Subjects:
Grades:
5th - 12th, Higher Education, Adult Education, Staff
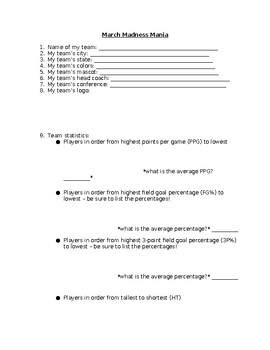
NCAA March Madness Basketball Tournament Team Research Statistics
Do you have students interested in the March Madness basketball tournament? Then this is the activity you need!To begin our March Madness unit, we look at all of the teams participating in the tournament and complete a map together to show where each team is from. We notice that some states have more than others and some states have none, and spend time discussing why that might be. Students will complete their own March Madness bracket.Students will then select a team in the NCAA March Madness
Grades:
4th - 9th
Types:

Scatter Plot and Bivariate Data Research Project
Students will begin a statistics project on one of their favorite restaurants or food chains! They will be researching nutrition facts and surveying others on what types of food they like to eat there. Through this data collection they will work on their skills of creating scatter plot graphs, creating relative frequency tables, and analyzing this data. This can be used either by paper or digitally. I used it the last two years during distance learning. Rubric included.
Subjects:
Grades:
7th - 12th
Types:
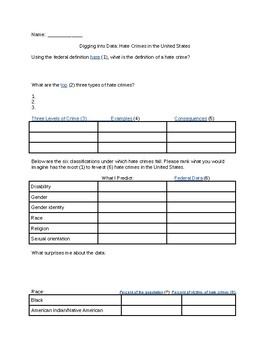
The 57 Bus- Looking at Hate Crime Data
A guided web search on hate crime data from the FBI, CDC, Pew Research Center, and U.S. Census Bureau. Uses reflection questions to make conclusions and predictions about the distribution of hate crimes. The kids are fascinated by the data!
Subjects:
Grades:
7th - 12th, Higher Education, Adult Education
Types:
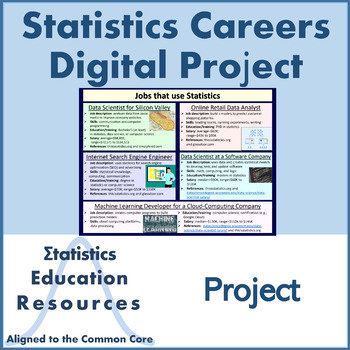
Careers in Statistics Digital Project
Distance Learning: Careers in Statistics Project Students complete this project by researching careers in statistics and creating a digital report. They select five careers and summarize their characteristics including job description, required skills (such as how statistics are used), education/training, and salary. Students may elect to create a digital poster (EDITABLE 24-inch by 18-inch template in PPTX included) or a short video report. Only want to assign a digital poster or only want vid
Subjects:
Grades:
9th - 12th
Types:
Also included in: Bundle: Algebra I Statistics Activities (Common Core Aligned)
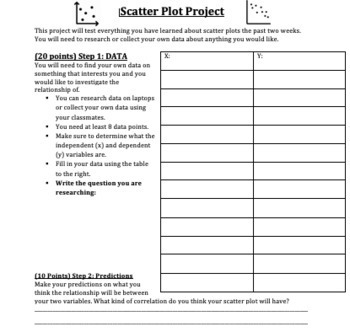
Scatter Plot Project
This is an awesome research project that is summative assessment for a Scatter Plot unit. For this project students are asked to pick a research question about bivariate data, gather the data online or through a survey. Next, they will make a prediction, construct a scatter plot, draw a line of best fit, find the equation of a line of best fit, and answer analytical questions about the data by interpreting the scatter plot. This is a great project that will allow students to utilize technology t
Subjects:
Grades:
7th - 10th
Types:
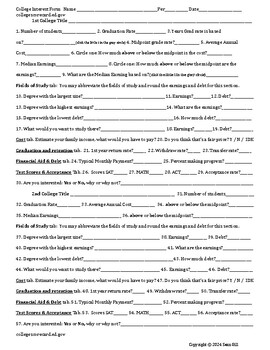
College Research Project Unit
This is an excellent unit on college research. If your school is college focused or you just need a interested based project to get the students engaged, this is a great way to get kids interested in colleges and their stats. Did you know that the federal government compiles all the FAFSA data? It keeps track of how much money each person who filled out a FAFSA makes over the long term (10 years+). There is a wealth of data on every college that has ever accepted federal funding and it is all at
Subjects:
Grades:
6th - 12th
Types:
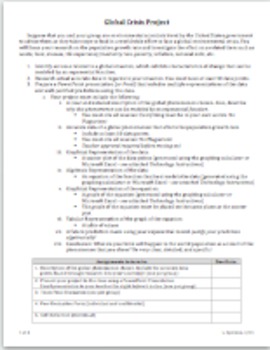
Global Crisis Project (Exponential Functions)
The goal of the Global Crisis Project is to have students see and understand real applications for exponential functions. Students will do research on the population growth rate (globally or they may choose a specific location) and investigate the effect that a related global issue such as waste, food, disease, life"expectancy/mortality rate, poverty, inflation, national debt, etc. has on population. Students find accurate data points from reliable internet sources, and will use exponential reg
Subjects:
Grades:
9th - 12th
Also included in: Math in the Real World Projects Bundle
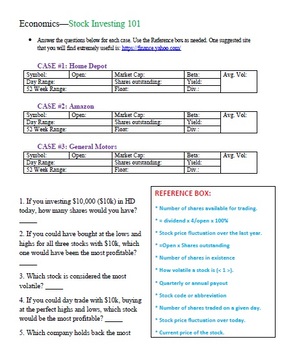
Stock Investing 101
For high school (and savvy middle school) economics students, Stock Investing 101 is a great tool for students to explore stocks on the Stock Market. This worksheet can be easily edited by simply changing the companies that the students need to investigate in order for it to be used over and over again. Estimated time for student completion: 45-60 minutes
Subjects:
Grades:
7th - 12th
Types:

Statistics Research Project
This project can be done in an Algebra 1 class or in a beginning Statistics class.Through this project students will...- Create a two-question survey questionnaire (using Google Forms).- Conduct a survey that will produce quantitative data.- Interpret survey data, and use Desmos to generate the line of best fit.- Find the correlation coefficient and use these values determine how well the line of best fit models the data.- Generate a residual plot and use it to interpret data.- Find the sum of t
Subjects:
Grades:
8th - 12th
Also included in: Math in the Real World Projects Bundle
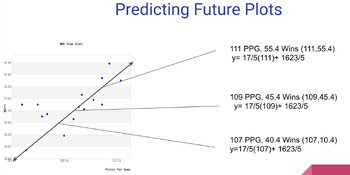
Scatter Plot Project on Desmos with Template
Learners will work to collect their own data from something they are interested in. They will then create a scatter plot using Desmos.com and analyze the information they collected. The analysis includes drawing their own trend line, finding the equation of that trend line, and predicting 3 values outside their original data collection. There are detailed directions with screenshots included along with a Google Slides template that can be shared with learners to help them organize their work. I
Subjects:
Grades:
7th - 9th
Types:
Silence the Violence -- International Data Analysis - 21st Century Math Project
Silence the Violence intends to take a closer look at gun violence throughout the world. Is there a correlation between gun ownership and gun violence? While this is on the news, and people argue back and forth, unfortunately there are not a lot of statistics cited.I built this project through the use of correlations of authentic international data. I have included content for either middle school (plotting and calculating) or high school (calculating correlation with summations). The results ar
Subjects:
Grades:
6th - 12th
Types:
CCSS:
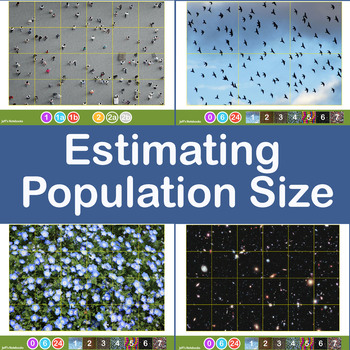
Estimating Crowd and Population Size using Jacob's Method
This investigation delves into estimating the size of a large population of objects by taking a sample and applying some basic mathematics. It encourages sharing of data, refining methods of collection of the data and discussion about the accuracy and limitations of the method used.Jacob's Method of counting large numbers of objects is simple. Draw a grid dividing the area covered into equal size squares. Estimate (by counting) the population of one grid then multiply this by the number of squar
Subjects:
Grades:
6th - 11th, Higher Education, Adult Education
Collecting & Analyzing Data Project | Line of Best Fit | Correlation Coefficient
Give your students some practical, real-world experience with this data-analyzing project. Things to know: 1. Prior to completing this project, students must be somewhat familiar with scatter plots, lines of best fit, correlation coefficients, and data displays. 2. This project will require collecting data via surveys. 3. Great group projects. 4. Allows for students to be creative and look for correlations between things they are interested in.
Subjects:
Grades:
8th - 10th
CCSS:
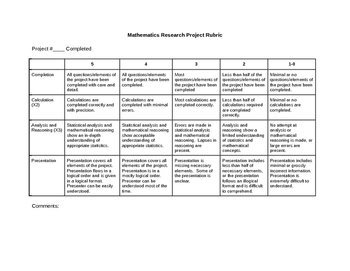
Math or Statistics Research Project Rubric
This editable rubric contains fields for project completion, calculation, analysis and reasoning, and presentation on a scale of five to one. It was originally designed for the Alberta Math 20-2 mathematics research project requirement, but is suitable for use across junior and senior high.
Subjects:
Grades:
9th - 11th
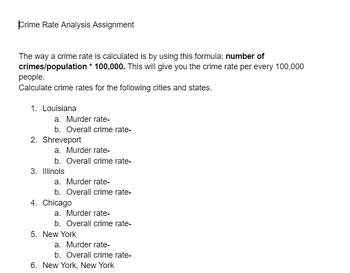
Crime Rate Analysis Assignment
A web based assignment to allow students to calculate the crime rates of various U.S. cities.
Grades:
5th - 12th, Higher Education, Adult Education
Types:

Creating Surveys and Analyzing Data, In-Class Activity
This activity walks students through the process of creating a survey, collecting results, and analyzing data. It is an assignment that can be done independently by students in class. Students that have any difficulty should be able to easily get assistance from fellow students. Rather than simply learning the terminology that comes with surveys and collecting research data, the student will use critical thinking to create and analyze their own surveys.
Subjects:
Grades:
10th - 12th, Higher Education
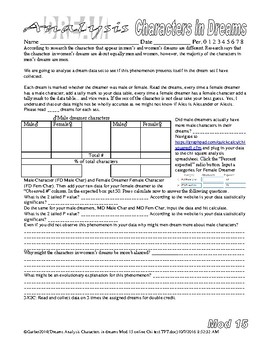
Psychology Dream Analysis Characters and Emotions in Dreams Freud
In these two labs the students analyze a dream set for characters, emotions and animals in dreams respectively. Research says that the characters in women’s dreams are about 50/50, men and women, but in men’s dreams there are more male characters than female characters. One of the labs focuses on this phenomenon. We endeavor to see if this is true in our dream set. The second lab focuses on whether whether or not men or women have more negative or positive dreams. 11/8/22 Animals in dreams is no
Subjects:
Grades:
10th - 12th, Higher Education
Types:
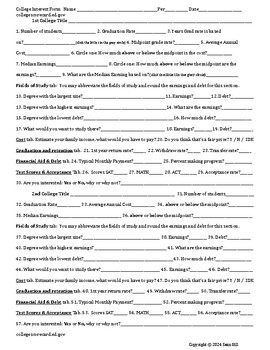
College Interest Form (College Research Unit 1st Lesson)
This is an excellent Introduction to college research. If your school is college focused or you just need a interested based activity to get the students engaged, this is an intriguing assignment that gets kids curious about different colleges and their stats. Did you know that the federal government compiles all the FAFSA data? It keeps track of how much money each person who filled out a FAFSA makes over the long term (10 years+). There is a wealth of data on every college that has ever accept
Subjects:
Grades:
6th - 12th
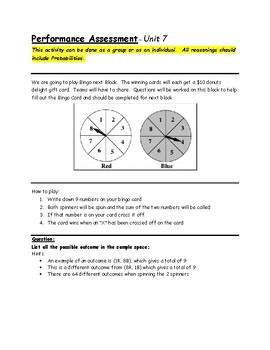
Assessment - Performance Task - Bingo Exploration
IB Applications & Interpretations SL: End-of-Unit Assessment performance task to create bingo cards by analyzing probabilities of numbers that are likely to be selected. Students will then compete in a bingo competition
Subjects:
Grades:
10th - 12th
Types:
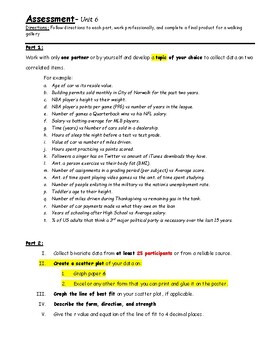
Assessment - Performance Task - Bivariate Data Research
IB Applications & Interpretations SL: End-of-Unit 6 Assessment - Bivariate Data Research Performance Task. Students work in pairs to collect data on two correlated items. After collecting data from 25 participants, students create a scatter plot, line of best fit and analyze the data. Students then perform a gallery walk and answer a series of reflection questions for positive/negative correlation, and zero correlation. Example and grading rubric included
Subjects:
Grades:
10th - 12th
Types:
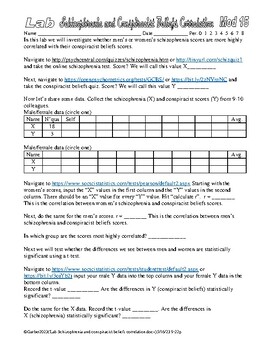
Psychology Schizophrenia and Conspiracist Beliefs Scores Correlation Statistics
In this lab we are finding out if men’s or women’s schizophrenia and conspiracist belief scores are more highly correlated.Students do the schizophrenia quizzes and conspiracist beliefs quiz, collaborate and share data then use a website to conduct the data analysis. It is inspired by this collection… https://www.teacherspayteachers.com/Product/Psychology-Lab-Trolley-Problem-Psychopathy-Scores-Correlation-Statistics-9499523 and the other correlation stuff I have set up…(I have a bunch, these are
Subjects:
Grades:
9th - 12th, Adult Education
Types:
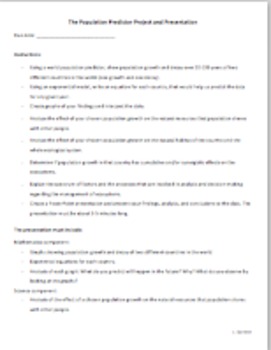
Population Predictor Project (Exponential Functions & Calculator Regressions)
This is an interdisciplinary project for math and science, where students analyze real-life applications of exponential functions.Using an online world population predictor, students will research population growth and decay over 50-100 years of two different countries in the world (one growth and one decay). Then, using an exponential model, they will write equations (algebraically) that would help them predict the data for any given year, for each country. They will create and analyze graphs,
Subjects:
Grades:
9th - 12th
Also included in: Math in the Real World Projects Bundle
e-Learning AnEconomist Online Course Coupen
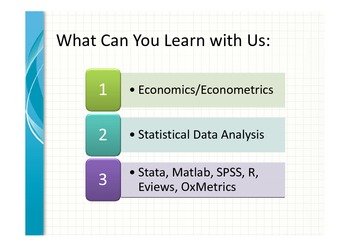
Please email this Coupen: TEACHPAYCOUP when you register for the courses in Econometrics, Stata, Matlab, SPSS, Eviews and R. You get 100GBP off the portal fee. Register on http://elearning.aneconomist.com and email on moodle@aneconomist.com ask for discounted invoice for your course. All courses are offered Online, Live and Personalized. Each lecture is recorded and recordings DVD will be provided after the course is completed.
Grades:
11th - 12th, Higher Education, Adult Education, Staff
Showing 1-24 of 100 results


