4,292 results
9th grade statistics independent works
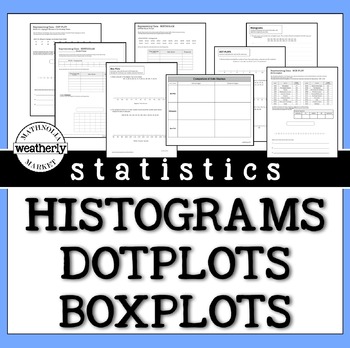
STATISTICS - Histograms, Dot Plots and Box Plots
There is no need to scour the internet for data. This resource includes the data and the format to challenge your students' skills with data displays.This packet includes worksheets that provide opportunities for students to create histograms, dot plots, and box plots.They can be used as guided practice or as "on your own" activities.INCLUDES3 worksheets with realistic data.3 worksheets with REAL data (Apple stock prices, US Olympic athlete ages, and the Oscars:Best Picture/ Movie Times)AND 3 wo
Subjects:
Grades:
6th - 9th
Types:
CCSS:
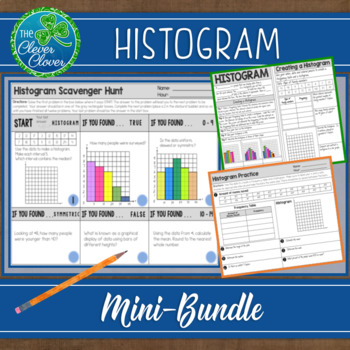
Histogram - Notes, Practice Worksheets and Scavenger Hunt
This histogram resource includes guided notes, a practice worksheet and a scavenger hunt. Your students will have the opportunity to create, interpret and discuss histograms. Below, you will find a detailed description of the notes, worksheet and scavenger hunt. Guided NotesThere are two small pages of guided notes. The first page provides the definition of a histogram and step by step instructions on how to create a histogram. The bottom portion of the notes has students examine three types (un
Subjects:
Grades:
6th - 9th, Adult Education
CCSS:
Also included in: Statistics Bundle - Guided Notes, Worksheets & Scavenger Hunts!
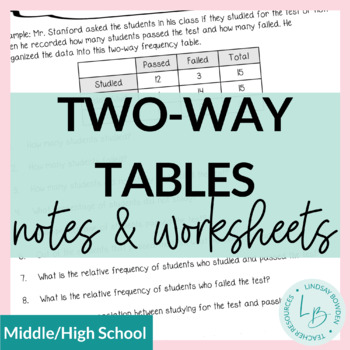
Two-Way Frequency Tables Notes and Worksheets
These two-way frequency table notes and worksheets are meant for an Algebra 1 statistics unit. However, they can also be used in middle school. They cover:Reading two-way frequency tablesFinding joint, marginal, and conditional relative frequenciesCreating two-way frequency tablesSee preview to view all pages! 4 pages + answer keys.You may also like:Two-Way Frequency Tables Task CardsBox and Whisker Plots Notes & WorksheetsHistograms Notes & WorksheetsTerms of Use:This product should onl
Subjects:
Grades:
8th - 10th
CCSS:
Also included in: Statistics Unit Bundle
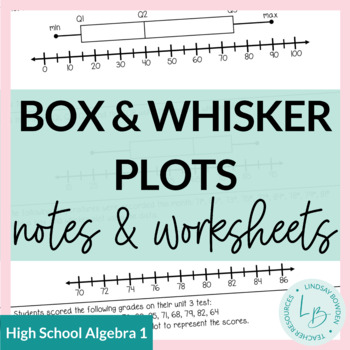
Box and Whisker Plots Notes and Worksheets
These notes and worksheets cover:RangeQuartiles and Interquartile RangeBox and Whisker PlotsIncludes 2 pages of notes and 2 worksheets. Answer keys included! These are meant for an Algebra 1 class, but can also be used for middle school (Texas standards for 7th grade). You may also like:Mean, Median, and Mode Notes & WorksheetsHistograms Notes & WorksheetsComparing Data: Spread, Shape, and Center Notes & WorksheetsTerms of Use:This product should only be used by the teacher who purch
Subjects:
Grades:
8th - 10th
CCSS:
Also included in: Statistics Unit Bundle
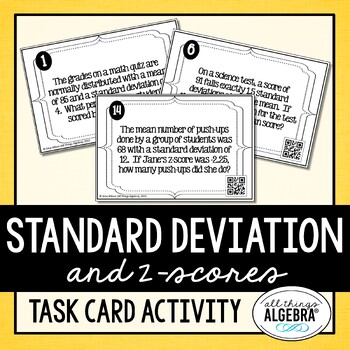
Normal Distribution, Standard Deviation, Z-Scores | Task Cards
Normal Distribution, Standard Deviation, Z-Scores Task CardsStudents will practice calculating and interpreting z-scores, normal distribution, and standard deviation in real world contexts by working through these 20 task cards. These are challenging and diverse questions that require students to read carefully. They can check their answers by scanning the QR code on each card. Connection to the internet is not required to scan the code. However, a QR scanner app is required on the device.
Subjects:
Grades:
8th - 12th
Types:
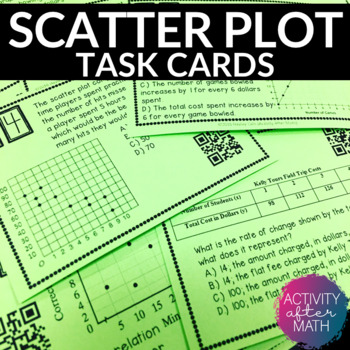
Scatter Plots and Line of Best Fit Task Cards with QR Codes
Get your students involved with practicing Interpreting Data with Scatter Plots and Line of Best Fit! Task cards include multiple choice problems and constructed response. Click here to SAVE and get this as a Task Cards BUNDLEThis resource includes:Teacher InstructionsTeacher TipsStudent Instructions24 Task cards with QR codes24 Task cards without QR codesBlank Answer Document for studentsAnswer Key for easy gradingOptions for using this resource:You can print the ones with QR codes for students
Subjects:
Grades:
8th - 9th
Types:
Also included in: 8th Grade MATH TASK CARDS BUNDLE
Two Way Relative Frequency Tables Worksheet
Are you a math teacher looking for engaging classwork or homework activities to help your students with relative frequency tables? Look no further! Our worksheet on completing two-way tables and creating relative frequency tables is perfect for your needs. Great for Pre-Algebra and Algebra 1 students. With real-world situations and comprehension questions based on relative frequency tables, students will learn to summarize and interpret data collected from the same subjects. They'll construct an
Subjects:
Grades:
8th - 9th
Types:
CCSS:
Also included in: Scatterplots Two Way Tables and Residual Plots Worksheets Bundle
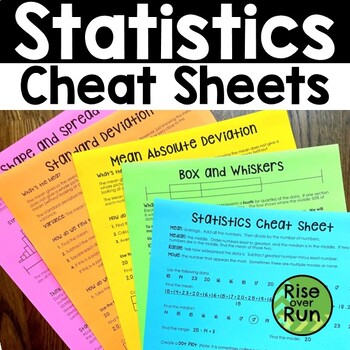
Statistics Cheat Sheets Notes with MAD, Standard Deviation, Shape & Spread
Grab these guided notes and "cheat sheets" to help your students understand statistics standards from Algebra I. Included Topics: Statistics Basics (mean, median, mode, range, dot plots, histograms, stem and leaf plots) Box and Whiskers Mean Absolute Deviation Standard Deviation Shape and Spread (Skewed Left and Skewed Right) The set includes each topic in the format of a cheat sheet and guided notes. The cheat sheets already have all the information filled in. They can be printed and given
Subjects:
Grades:
9th - 10th
Types:
CCSS:
Also included in: Algebra 1 and 8th Grade Math Curriculum Bundle for Entire Year
Correlation vs Causation Worksheet
Hello Math Teachers! Help your math students understand the difference between correlation and causation with our fun activity worksheet. Students will evaluate 42 statements and determine whether they demonstrate correlation or causation, and there are some multiple-choice questions as well. This activity also includes a puzzle that generates an answer, making it easy to grade.This two-sided worksheet is great for classwork or homework and is designed to help students develop critical thinking
Subjects:
Grades:
9th
Types:
CCSS:
Also included in: Algebra Math Riddle Worksheets
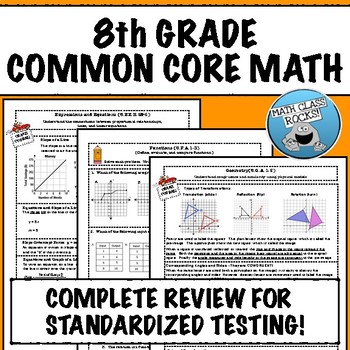
8TH GRADE MATH COMMON CORE REVIEW
If you need to prepare your students for a standardized test based on the Common Core, this “crash course” is exactly what you need! Organized by standard and easy to use, just print and let the reviewing begin! What's Included?This download consists of 10 “crash course” reviews with explanations and examples. Every "crash course" is followed by a practice assessment comprised of items aligned with standardized state tests. The Number SystemKnow that there are numbers that are not rational, a
Subjects:
Grades:
7th - 9th
Types:
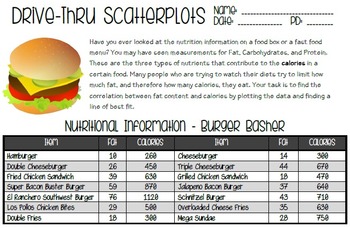
Drivethru Scatter Plots - Line of Best Fit Activity
This activity is a fun way to work with scatter plots in a realistic situation. Students will compare the fat and calories in items from a fictional fast food restaurant by creating a scatter plot. They will also draw a line of best fit, approximate the slope of that line, and make predictions based on the line.
Included:
*Drive-Thru Scatterplots Activity
*Answer Key
Please leave feedback with any suggestions for improvements! :)
Subjects:
Grades:
8th - 9th
Types:
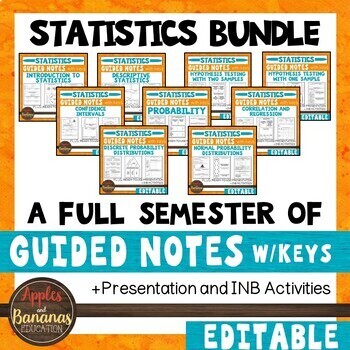
Statistics Interactive Notebook Activities & Guided Notes Bundle
These Statistics products are flexible, editable, and can be used for in-person or distance learning. Each unit contains guided notes embedded with student practice problems (keys included), foldable activities, and a PowerPoint presentation for focused instruction. Choose what works best for your class/student and modify to make the content fit your needs. Notes are designed to clearly present the topics and reach all types of learners. Take the time and stress out of creating your own guided n
Subjects:
Grades:
9th - 12th
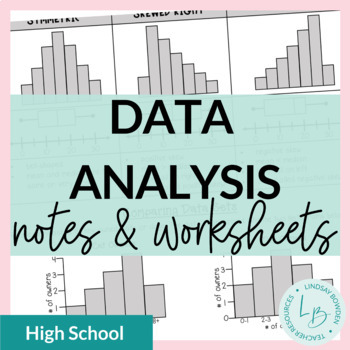
Data Analysis: Shape, Center, and Spread Notes and Worksheets
These data analysis notes and worksheets compare two data sets with regards to shape, center, and spread of data.They cover:comparing data of two sets using histograms, dot plots, box and whisker plots,and stem and leaf plotsshape (symmetrical, skewed right, skewed left)center (mean, median)peaks (mode)spread analyzing what these factors mean in context of the problem4 pages + all answer keysYou may also like:Mean, Median, and Mode Notes & WorksheetsBox and Whisker Plots Notes & Workshee
Subjects:
Grades:
8th - 10th
CCSS:
Also included in: Statistics Unit Bundle
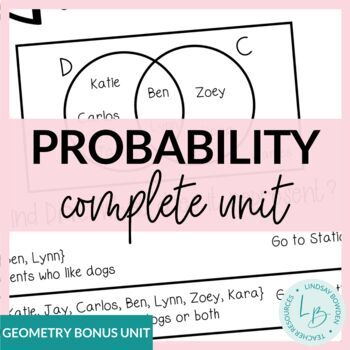
Probability Unit Bundle
Get a complete High School Compound and Conditional Probability unit including lessons on set theory, outcomes, and basic, compound, and conditional probability, and more! These ready-to-use resources include everything you need to teach high school probability to your on-level or lower-level/special education class. Supplements would be needed for an honors class.This is a bonus unit that's included in my Geometry Curriculum.Each unit contains guided notes, practice worksheets for the classroo
Subjects:
Grades:
9th - 11th
Types:
CCSS:
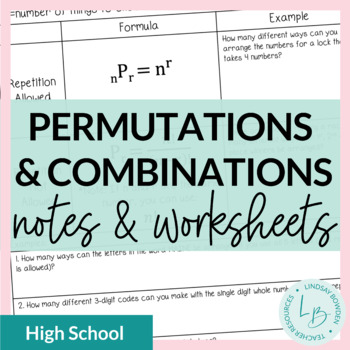
Permutations and Combinations Notes & Worksheets
These permutations and combinations guided notes cover:intro to permutations, combinations, and factorialsintro to finding permutations (with and without repetition) intro to finding combinations (with and without repetition)2 practice worksheets with permutations and combinations**NOTE: This does not include finding compound probabilities with permutations/combinations. It only covers finding the number of outcomes using permutations and combinations.I included two versions of the combination n
Subjects:
Grades:
9th - 11th
Also included in: Probability Unit Bundle
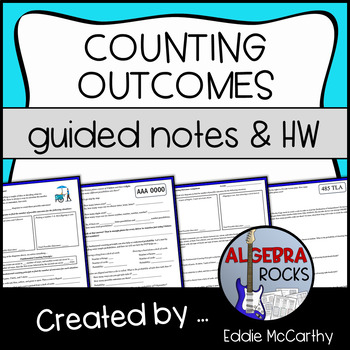
Counting Outcomes and the Fundamental Counting Principle Guided Notes & Homework
* Download the preview for details! *This lesson includes 2 pages of guided notes and a 2-page assignment. Students learn about the fundamental counting principle in the order below. They will:- Discover the concept through tree diagrams- Practice applying it to different situations (dice, outfits, spinners, etc.)- Discover how many different Ohio license plates are possible- Relate the fundamental counting principle to probabilityAnswer key is included!* This lesson leads into my Permutations a
Subjects:
Grades:
6th - 12th
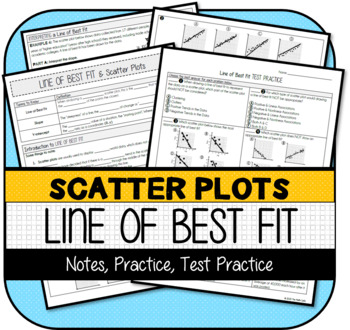
Scatter Plots: Line of Best Fit NOTES & PRACTICE
This resource contains the following items:1) Introduction to Line of Best Fit NOTES & PRACTICE2) Interpreting Line of Best Fit NOTES & PRACTICE3) Line of Best Fit TEST PRACTICE --8 Multiple Choice Questions --Printable --Version for Google Forms (auto-graded)4) Answer Keys to All PartsThis resource was developed to meet the requirements of the 8th Grade Statistics & Probability standards below:CCSS.MATH.CONTENT.8.SP.A.2 Know that straight lines are widely used to model
Subjects:
Grades:
7th - 9th
Also included in: Scatter Plots MINI-BUNDLE
Estimating Correlation Coefficient with Scatter Plots Worksheet
Attention Math Teachers! Are you looking for a way to help your students master estimating correlation? Look no further! Our engaging worksheet is designed to match scatter plots with the correct correlation coefficient. With a variety of reasonable choices, students will estimate the correct r value and interpret positive and negative slope, as well as the strength or weakness of the correlation coefficient of a linear fit.This two-sided worksheet comes with an easy-to-use key and is perfect fo
Subjects:
Grades:
9th
Types:
CCSS:
Also included in: Data and Statistics Worksheets Bundle
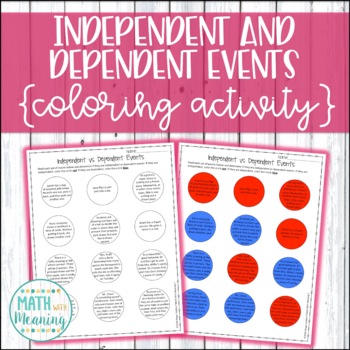
Independent and Dependent Events Coloring Activity - Compound Probability
Take a break from typical worksheets with this coloring activity! Students will read 12 sets of compound events and determine if they are independent or dependent events. Many examples of real-world events are included. This is a great activity for students learning compound probability who struggle with differentiating between independent and dependent events.Two versions of the activity are included: one that asks students to use the colors red and blue for uniformity and easy grading, and one
Subjects:
Grades:
6th - 9th
Types:
CCSS:
Two Way Tables Worksheet
Attention Math Teachers! Download this two-sided worksheet on completing two-way tables and analyzing bivariate data today! This worksheet is perfect for Pre-Algebra and Algebra 1 students as a classwork or homework activity.By completing this worksheet, students will check their understanding of how patterns in bivariate data can be seen by displaying frequencies and relative frequencies in a two-way table. They will also learn how to construct and interpret two-way tables, summarizing and inte
Subjects:
Grades:
8th - 9th
Types:
CCSS:
Also included in: Scatterplots Two Way Tables and Residual Plots Worksheets Bundle
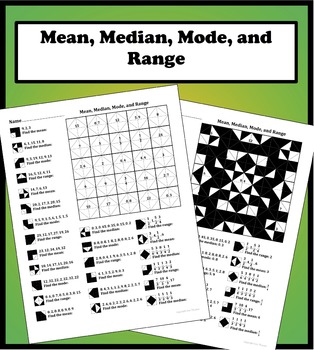
Mean, Median, Mode, and Range Color Worksheet
25 carefully thought out problems on finding the mean, median, mode, and range. The problems start off easy and slowly work their way to more difficult problems including decimals and fractions.
Each question corresponds to a matching answer that gets colored in to form a symmetrical design. Not only does this make it fun and rewarding for students but it also makes it easy for students and teachers to know if the worksheet has been completed correctly. Great for classwork, homework, addition
Subjects:
Grades:
5th - 9th
Types:
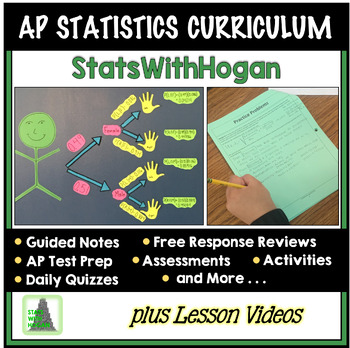
AP Statistics Curriculum Mega Bundle (with videos of each lesson)
This Bundle contains everything you will need to prepare your students for success on the AP® exam.I have designed these lessons over the past 12 years teaching AP Statistics. The organization and rigor of the lessons and practice have produced an AP pass rate well over the national average.I am redesigning the notes to make improvements including power point slides and keynote to present lessons. The upgrades will be free to those who have purchased this bundle. The curriculum was redesigned i
Subjects:
Grades:
9th - 12th, Higher Education
Types:
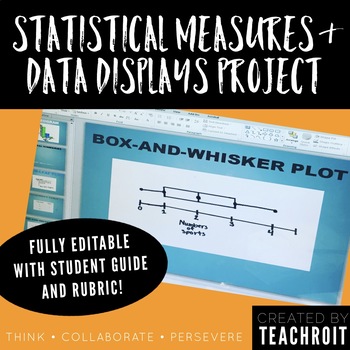
Statistics & Data Display Project for 6th Grade Math PBL (Fully Editable)
This product includes a student guide for a 6th grade middle school mathematics project that will require students to develop a statistical question, conduct a survey with their classmates, create numerical summaries, represent their findings using visual data displays, and finally present their findings! The thorough student guide provides step by step directions for each part of the project and could be used as either an in class project or to be assigned as homework. The student guide also in
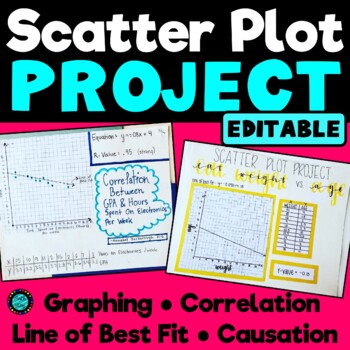
Scatter Plot Statistics Project Correlation Causation Trend Line EDITABLE
A great project to assess students' mastery of scatter plots and bivariant data, correlation coefficient, association, line of best fit, the equation of the line of best fit, and causation. Students are asked to research or collect their own data on the topic of their choice (for example: find the current age and yearly salaries of 10 famous actors, find the height and shoe sizes of 10 different students, or measure the arm span and height of 10 different people). They will display and include
Subjects:
Grades:
7th - 10th
Types:
Showing 1-24 of 4,292 results


