1,109 results
9th grade statistics lessons
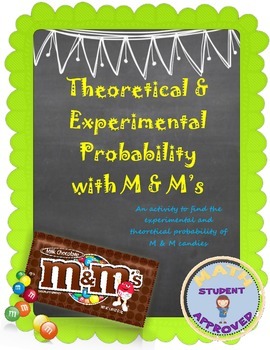
Theoretical and Experimental Probability M&M activity
Students need to find the probability of picking certain colored M&Ms, and asked to change them into decimals, fractions, and percents. They are asked to draw specific M&Ms at random for experimental probability problems. They are asked to make a few predictions, as well. This is a lengthy lesson and takes a while to get through, so make sure you have enough time to get through it. It can be done in 2 days, and if you need to use colored chips or counters instead, go for it!
Subjects:
Grades:
5th - 11th
Types:
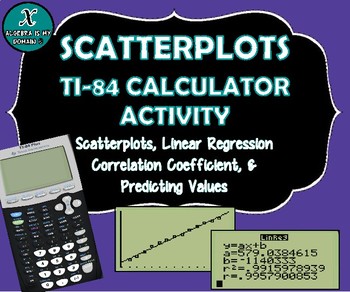
TI-84 CALCULATOR ACTIVITY - Data, Scatterplots, Regression & Line of Best Fit
This file includes four linear regression examples (all real-life data). The examples cover the following topics for the TI-84 graphing calculator:
* Creating a scatterplot
* Performing linear regression (finding the equation of the best-fit line)
* Interpreting the slope of the equation
* Calculating and interpreting the correlation coefficient
* Predicting values (using the linear regression equation)
The first example gives the step-by-step instructions to calculate all the necessary value
Subjects:
Grades:
7th - 12th, Higher Education
Types:
CCSS:
AP Statistics Curriculum Mega Bundle (with videos of each lesson)
This Bundle contains everything you will need to prepare your students for success on the AP® exam.I have designed these lessons over the past 12 years teaching AP Statistics. The organization and rigor of the lessons and practice have produced an AP pass rate well over the national average.I am redesigning the notes to make improvements including power point slides and keynote to present lessons. The upgrades will be free to those who have purchased this bundle. The curriculum was redesigned i
Subjects:
Grades:
9th - 12th, Higher Education
Types:
Mean Absolute Deviation - Class Challenge
Are you looking for an engaging way to teach Mean Absolute Deviation? Look no further! My students love completing this lesson.
This product is designed to help your students master the MAD in three easy steps.
1) Guided Notes – The guided notes contain an introduction to calculating MAD. Students will write the overall meaning of the MAD and the steps to calculating. There is an example problem for the teacher to model and then two “you try” problems for students to try independently a
Subjects:
Grades:
6th - 9th
Types:
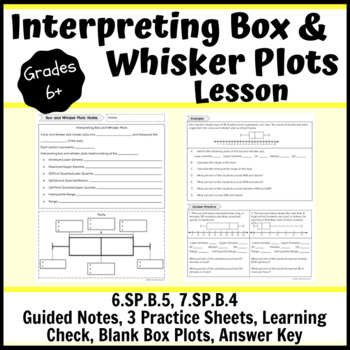
Interpreting Box and Whisker Plots Lesson- Notes, Practice, Learning Check
This interpreting box and whisker plots lesson consists of a guided notes sheet, 3 practice sheets, a learning check, 2 different half sheets of blank box plots and an answer key. You can hole punch the note pages and have students place them in their binders or a 3-prong folder. There are teacher notes to guide you through the direct instruction with students. There are three pages of practice. One page can be used as independent practice when students are ready; this could be in class or homew
Subjects:
Grades:
6th - 10th
Types:
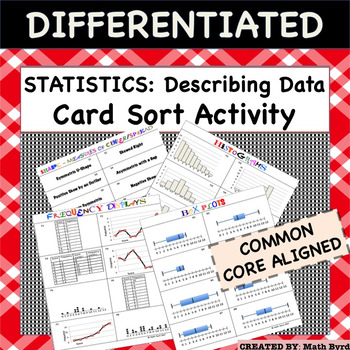
Statistics:Representing & Interpreting Data (Histogram, Box Plot, Dot Plot)
Complete Lesson! This lesson features a 40 CARD SORT, Differentiated Cornell Notes, Distribution Shapes Graphic Organizer, and Power Point to go with the notes! Perfect for the inclusive classroom! Within the Card Sort Activity there are 5 categories of cards to match: 1) Histogram2) Frequency Display (including Dot Plots, Frequency Line Graphs and Tables)3) Box Plots4) Describing Shape5) Describing Measures of Center & Spread. With 8 different sets of matches, there are 40 cards total. Stud
Subjects:
Grades:
8th - 12th
Types:
CCSS:
Also included in: Common Core Algebra 1 CARD SORT ACTIVITIES - BUNDLE PRICE!
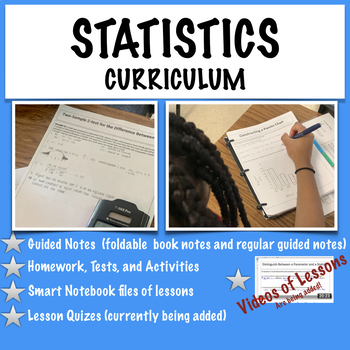
Statistics-Whole Curriculum (with videos of lessons)
This bundle will contain a whole curriculum for a introductory statistics course. The lessons are suitable for a college introductory course or a full year high school introductory statistics course.The bundle contains the following lessons: Unit 1: -Lesson 1: Introduction to Statistics -Lesson 2: Classifying Data -Lesson 3:Experimental Design Assignments/Activity/Quizzes for each lesson Pacing guide Test Unit 2: -Lesson 4:Frequency D
Subjects:
Grades:
9th - 12th, Higher Education
Types:
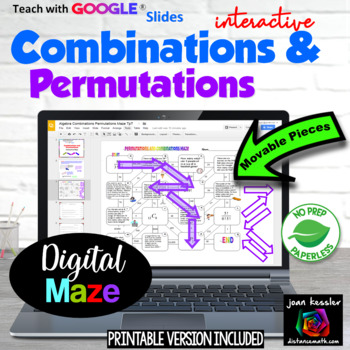
Permutations and Combinations Digital Maze + HW and Printable version
This Combinations, Permutations, and Counting Fun Maze is NO PREP for you and engaging,challenging, and fun for your students. This resource included both a digital and printable version. This activity reinforces the concepts of permutations, combinations, and counting principles and is great practice. The different types of problems are placed randomly in the maze so that students must first decide the type of question before solving. The questions on the maze are letter coded so that if a s
Subjects:
Grades:
8th - 11th
Types:
CCSS:
Also included in: Algebra 2 Digital MEGA Bundle plus Printables
High School Data Analysis Project
This project covers a large range of data analysis methods. There are eleven total parts to the project.
Part One: the students have to collect data from 20 students outside of the classroom. Directions specify to ask students from each grade level.
Part Two: Measures of Center and Variation. Students will calculate mean, median, mode, range, and standard deviation for some of the data collected. Definitions of each term are included.
Part Three: Box-And-Whisker Plot. Students will create t
Subjects:
Grades:
9th - 12th
Types:
CCSS:
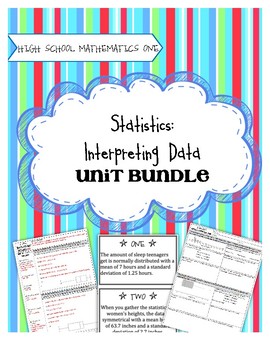
High School Math 1: Statistics and Interpreting Data
Task-Based Learning gets students intrinsically motivated to learn math! No longer do you need to do a song and dance to get kids interested and excited about learning. The tasks included in this unit, followed by solidifying notes and practice activities, will guarantee that students understand the concepts. This unit covers:
- Displaying one-variable data in a histogram, dot plot, or box plot
- Describing the distribution of data using statistical vocabulary
- Using data models and stati
Subjects:
Grades:
8th - 10th
Types:
CCSS:
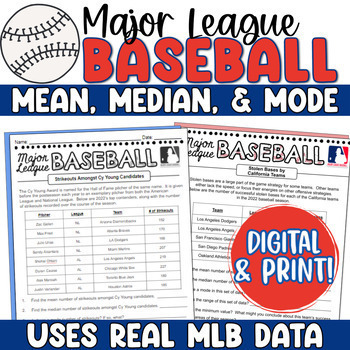
Baseball Math Mean, Median, Mode - MLB Baseball Measures of Central Tendency
This real-world baseball math statistics project asks students to determine mean, median, mode, and range for a variety of actual statistics from the 2023 Major League Baseball season. Perfect to excite any sports enthusiasts! It includes both a traditional print option and a digital version, made for Google for any 1:1 classrooms!Each slide within the activity is dedicated to a different statistic (for example, strikeouts amongst Cy Young candidates, or homeruns amongst MVP candidates). Stud
Subjects:
Grades:
6th - 9th
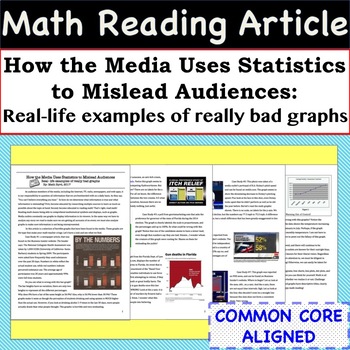
Statistics Math Article - Case Studies of Bad Graphs found in the Media
Incorporate Reading & Writing into the Math Classroom with this article and accompanying worksheet! The 4 page article is entitled - "How the Media Uses Statistics to Mislead Audiences: Real- life examples of really bad graphs". The worksheet helps students summarize the case studies and the article as a whole. This resource can be used in so many ways, some ideas are: station activity, independent reading assignment, small group activity, homework assignment, or whole class discussion.Skill
Subjects:
Grades:
8th - 11th
CCSS:
Also included in: Common Core Algebra 1 MATH READING ARTICLES - BUNDLE PRICE!
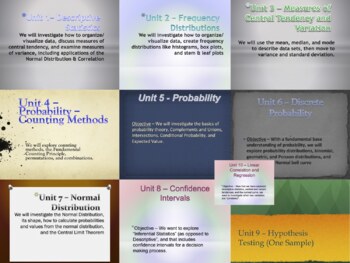
A Mountain of Statistics Curriculum - One Full Year Bundle
This is a bundle of 10 Units, Midterm Exam, & Final Exam designed for a high school Statistics Class (can be applied to University discipline). Each unit plan includes Common Core Standards, Key Concepts/Enduring Understandings, Essential Questions/Do Now, Activities, Resources, Procedures, and Assessment techniques. It is designed to be a lifelong tool that you can add to, edit, and re-use every year! Please see each Unit Statistics Product in the MountainWorks Store (sold separately) for
Subjects:
Grades:
9th - 12th, Higher Education
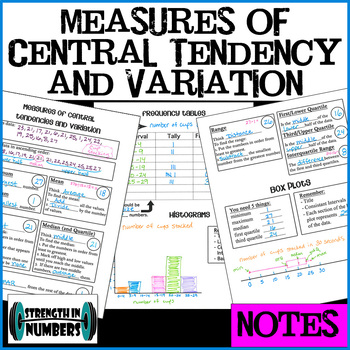
Interactive Notebook NOTES: Mean Median Mode Range Quartiles Box Plot Histogram
This set contains suggestions for student data collection and notes that use the data for measures of central tendencies and variation (mean, median, mode, range, first and third, quartiles, interquartile range, outliers), box plots, frequency tables, and histograms! Sounds like so much but these topics all go together so well. And by using data collected by students ABOUT students, they will be much more interested. This product contains ideas for collecting data, three full size (8.5x11) pa
Subjects:
Grades:
6th - 9th
Also included in: Complete BUNDLE of 50 Foldable Notes for Math 7
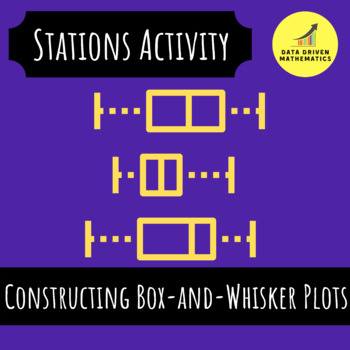
Constructing Box-and-Whisker Plots - Stations Activity
About This Resource:In this activity students will practice constructing box-and-whisker plots when provided a data set. Students will need to calculate the five number summary (minimum, first quartile, median, third quartile, and maximum) in order to be successful on this activity. The prep required by the teacher consists of printing the stations cards, making a copy of the graphic organizer for each student, and setting the expectations and instructions with their students.Your students will
Subjects:
Grades:
6th - 12th
Types:
CCSS:
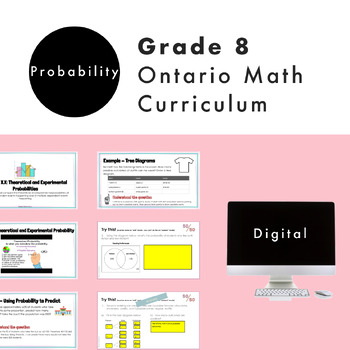
Grade 8 Ontario Math Probability Digital Google Slides + Form
Do you need a practical and engaging resource for the NEW Ontario Math Number strand? Are you planning for the NEW Grade 8 Ontario Math Curriculum? This editable Google Slide resource is what you need! This resource is for the Grade 8 DATA strand and covers specific expectations for “D2 Probability". In this resource, students will experience math through engaging real-life questions, storytelling through math, and interactive slides. What’s Included2 Google Slide presentations67 UNIQUE and ED
Subjects:
Grades:
7th - 9th
Types:
Also included in: Grade 8 NEW Ontario Math Curriculum Full Year Digital Slides Bundle
Food Waste and Mathematics: From Farm to Table to Dump
Here's a very uncomfortable fact: it takes 4 pounds of potatoes to make 1 pound of potato chips. That means that for every 1 pound bag of potato chips you eat, 3 pounds of potatoes have to be thrown away. What a waste of food! This is a series of activities that looks at the hidden world of food waste. It includes a look at how much food is wasted as it is "processed" into finished products like french fries and potato chips. It also includes mathematical activities where students calculate how
Subjects:
Grades:
5th - 12th, Adult Education
Types:
High School Math 1: ENTIRE YEAR BUNDLE!
This is a $144 dollar value!
This bundle includes absolutely everything you need to teach the entire High School Math 1 year-long 9th grade course. There are 10 full units included in this bundle purchase, including all developing tasks, solidifying notes, practice activities, and assessments. These are the units included in this purchase:
Unit 1: Geometry and Rigid Transformations
Unit 2: Statistics and Interpreting Data
Unit 3: Expressions and Equations
Unit 4: Compound Inequalities and Abso
Subjects:
Grades:
8th - 10th
Types:
CCSS:
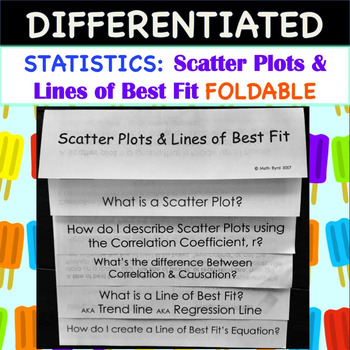
Statistics:Scatter Plots and Lines of Best Fit FOLDABLE
So Easy to Use! Simply print and fold! No need to rotate pages! Scatter Plots and Lines of Best Fit FOLDABLE also includes a PowerPoint to go along with the foldable.Foldable has 2 tiers of differentiation, perfect for the inclusive classroom! 1 set has fill-in-the-blank style notes within the foldable, while the other foldable has the notes already filled in. On both sets, students will have to work out the examples.Students will learn how to: Create Scatter PlotsDescribe Scatter Plots using Co
Subjects:
Grades:
8th - 11th
CCSS:
Also included in: Common Core Algebra 1: STATISTICS UNIT - BUNDLE PRICE!
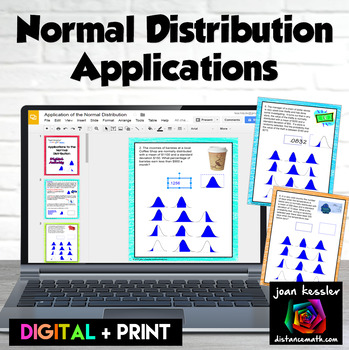
Normal Distribution Applications Digital Activity plus Print
In this digital interactive activity for Applications of the Normal Distribution your students will solve 10 real world applications of the Normal Distribution with GOOGLE® Slides. They will first analyze the problem, then “sketch” the scenario by selecting one of 12 shaded normal distribution diagrams, and then determine the solution either using technology or manually by tables using z-scores.A printable version of the questions is also included. Students will also read, analyze and sketch
Subjects:
Grades:
9th - 12th
Types:
CCSS:
Also included in: Probability and Statistics Algebra 2 Unit 11 Activity Bundle
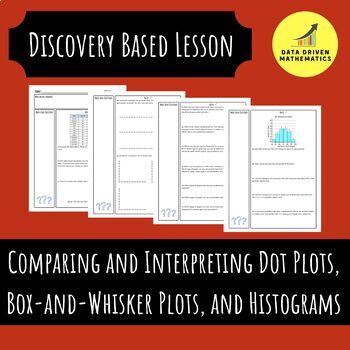
Comparing and Interpreting Dot Plots, Box-and-Whisker Plots, and Histograms
About This Resource:A four page packet containing an investigation into comparing and interpreting dot plots, box-and-whisker plots, and histograms. In addition, you will receive the answer key to help with the implementation of this activity in your classroom. The worksheet flows perfectly and could be used in more of a discovery format or a instructor guided notes.What's Included:You will receive a zipped folder. Inside the zipped folder is a worksheet and the answer key in PDF format.Similar
Subjects:
Grades:
6th - 10th
CCSS:
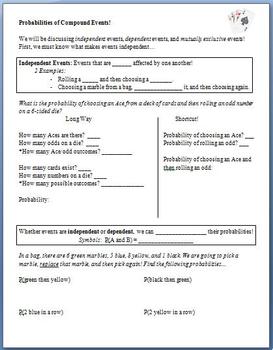
Probability of Compound Events (Guided Notes)
This lesson is meant to be used as guided notes for a whole class.
Students begin by learning what makes 2 events independent. After slowly working through a problem about rolling a die and choosing a card, they discover that they can multiply probabilities when working with these compound events. They then attempt problems involving picking marbles from a bag. Next, they learn about dependent events, and finally, mutually exclusive events.
The last 2 pages are a copy of the key.
Subjects:
Grades:
6th - 12th
Types:
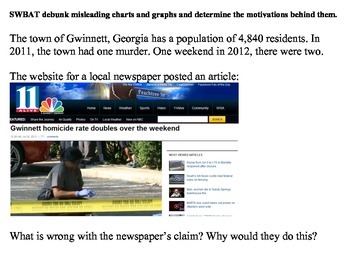
Misleading Charts and Graphs (Statistics)
Teaching students to deduce information provided in charts and graphs is an essential part of any math curriculum.
However, what do you do when the graph itself provides misleading or false information?
This lesson is a good way to get students to look critically at graphically displayed data and see through those who try to manipulate data for their own purposes.
Subjects:
Grades:
7th - 12th, Higher Education, Adult Education
Types:
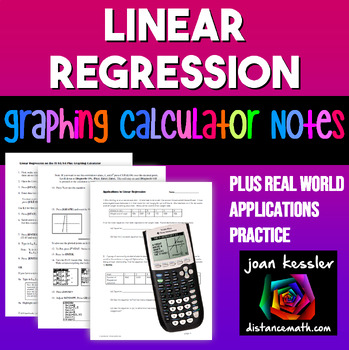
Linear Regression | TI-84 Graphing Calculator plus Applications
This clear, concise, step by step notes help your students use the TI 83 and TI 84 Graphing Calculator to enter data into lists, create a linear regression equation and to plot the equation along with the data simultaneously. Also included is a 3 page worksheet with five real world examples for students to practice. Solutions included. These can be used as Binder Notes or printed smaller for Interactive Notebooks._________________________________________________Related Products★ Quadratic Re
Subjects:
Grades:
9th - 11th, Higher Education
Types:
CCSS:
Also included in: Linear Functions and Systems Algebra 2 Unit 2 Activity Bundle
Showing 1-24 of 1,109 results


