Statistics Cheat Sheets Notes with MAD, Standard Deviation, Shape & Spread
Rise over Run
23.7k Followers
Grade Levels
9th - 10th
Subjects
Resource Type
Standards
CCSSHSS-ID.A.1
CCSSHSS-ID.A.2
CCSSHSS-ID.A.3
Formats Included
- PDF
Pages
10 pages
Rise over Run
23.7k Followers
What educators are saying
My students enjoyed learning the lesson on Center, Speared and shapes using these resources and they were engaged during the activity.
This resource was used in the students' interactive notebooks for the statistics unit. Highly recommend.
Also included in
- Do you love discovery learning, collaboration, hands-on activities, and projects that help students make sense of the math they are learning? This curriculum is packed with engaging and challenging Algebra I and 8th grade math resources for the whole year. A variety of activities, inquiry learningPrice $350.00Original Price $677.94Save $327.94
- This curriculum bundle includes a variety of activities, assessments, games, group activities, projects, inquiry lessons, guided notes, and more for teaching Algebra I CCSS standards. The activities are centered on discovery learning and engaging activities with real world connections. Lessons helpPrice $225.00Original Price $445.21Save $220.21
Description
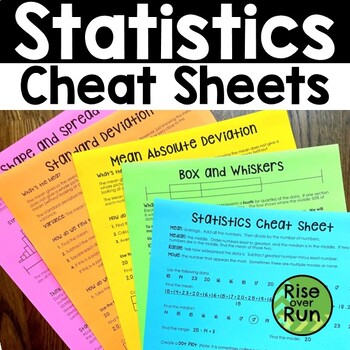
Grab these guided notes and "cheat sheets" to help your students understand statistics standards from Algebra I.
Included Topics:
- Statistics Basics (mean, median, mode, range, dot plots, histograms, stem and leaf plots)
- Box and Whiskers
- Mean Absolute Deviation
- Standard Deviation
- Shape and Spread (Skewed Left and Skewed Right)
The set includes each topic in the format of a cheat sheet and guided notes. The cheat sheets already have all the information filled in. They can be printed and given to students as a reference. The guided notes have blanks and spaces for students to fill in.
Note: The Guided Notes included closely follow the Cheat Sheets. These can be followed and used as answer keys.
Total Pages
10 pages
Answer Key
Included
Teaching Duration
2 days
Report this resource to TPT
Reported resources will be reviewed by our team. Report this resource to let us know if this resource violates TPT’s content guidelines.
Standards
to see state-specific standards (only available in the US).
CCSSHSS-ID.A.1
Represent data with plots on the real number line (dot plots, histograms, and box plots).
CCSSHSS-ID.A.2
Use statistics appropriate to the shape of the data distribution to compare center (median, mean) and spread (interquartile range, standard deviation) of two or more different data sets.
CCSSHSS-ID.A.3
Interpret differences in shape, center, and spread in the context of the data sets, accounting for possible effects of extreme data points (outliers).


