STATISTICS - Histograms, Dot Plots and Box Plots
- PDF
What educators are saying
Description
There is no need to scour the internet for data. This resource includes the data and the format to challenge your students' skills with data displays.
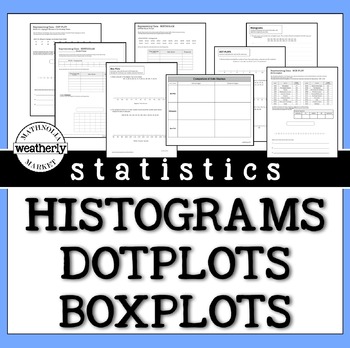
This packet includes worksheets that provide opportunities for students to create histograms, dot plots, and box plots.
They can be used as guided practice or as "on your own" activities.
INCLUDES
3 worksheets with realistic data.
3 worksheets with REAL data (Apple stock prices, US Olympic athlete ages, and the Oscars:Best Picture/ Movie Times)
AND 3 worksheets for student produced (or gathered) data.
Each set of worksheets includes histograms, dot plots and box plots.
Solution keys are included.
This resource also includes a chart for comparing the advantages and disadvantages of each type of data display..
This activity supports Common Core HSS.ID.A.1 - Represent data with plots on the number line (dot plots, histograms, and box plots).
This standard may be used as part of your Algebra curriculum or in a stand-alone mini-course, such as an after-school / summer program.


