15 results
Statistics flash card microsofts
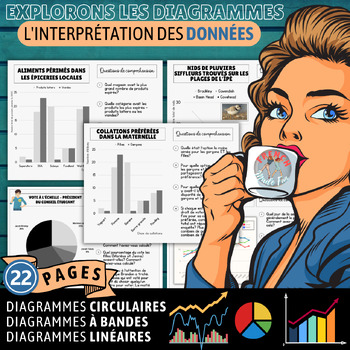
FRENCH MATHS | CHARTS | DIAGRAMMES | REPRÉSENTATION GRAPHIQUE | INTERPRÉTER
Creating charts that are precise, effective, visually appealing and authentic is a pretty big feat! Do away with the anchor chart paper and the countless hours or prep-work and use these to amp up your teaching! I use these with my grades 5 and 6 students in my split class, but they can easily be used as Reachback or revision in grade 7 or for students needing extra exposure; like younger students who are enriched or older students who are in adaptation scolaire.This collection of 11 charts with
Subjects:
Grades:
5th - 6th
Types:
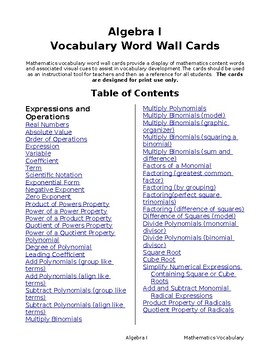
Algebra I Vocabulary Posters (110 Pages )
Looking for a quick and easy way to practice Math Vocabulary?These colorful and concise Posters and Flashcards are a great way to reinforce math concepts. Hang on a bulletin board and keep on a ring for reviewing.
Subjects:
Grades:
6th - 12th, Higher Education, Adult Education
Types:
Math Vocabulary Posters & Flash Cards for grade 8(Editable & fillable resource)
Looking for a quick and easy way to practice Math Vocabulary?These colorful and concise Posters and Flashcards are a great way to reinforce math concepts. Hang on a bulletin board and keep on a ring for reviewing.
Subjects:
Grades:
7th - 9th
Types:
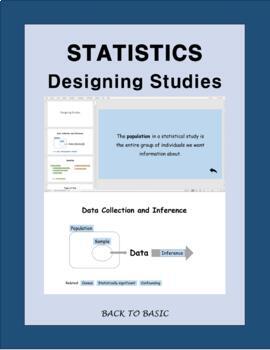
AP Statistics Designing Studies - Sampling, Observational Study, and Experiment
Hello,I created this teaching material to organize key ideas of designing studies with statistical terminologies. While teaching statistics to students, I realized that many students find statistics course challenging and one of the reasons for that is because they struggle to see overall ideas of topics. In this powerpoint presentation, the overall ideas of designing studies are organized and definitions of key ideas and vocabulary are linked so that they can be seen if you click the words. In
Subjects:
Grades:
9th - 12th, Higher Education
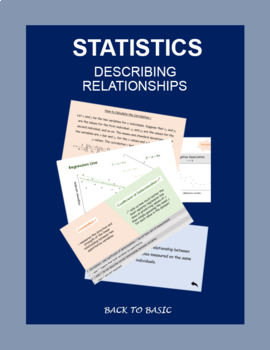
AP Statistics Describing Relationships - Correlation, Residuals, Regression Line
I created this PowerPoint slides to organize key ideas of AP Statistics Chapter 3 Describing Relationships. This PowerPoint is designed to help students understand the connections among key terminologies and see the overall ideas. I used diagrams and color codes to better organize related concepts and linked newly introduced terminologies to corresponding vocabulary cards. Vocabulary cards can be used separately as you teach each terminology or can be referred to as you use the slides showing re
Subjects:
Grades:
9th - 12th
Types:
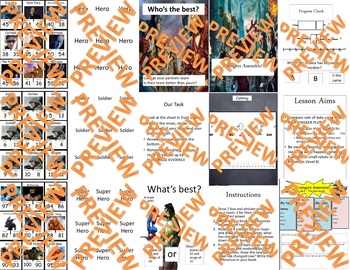
Box and Whiskers plots - FULL FUN, ENGAGING LESSON
Box and Whiskers plots - FULL FUN, ENGAGING LESSONS - AVENGERS, SUPER HEROES, HEROES THEME!
Simply download and print and you will have fully planned lessons with all the exciting resources.
Can be adapted for lower ability classes. Cards activity.
Averngers cards can be used for a variety of lessons from as simple addition and subtraction activity with primary school pupils to teaching boxplots to higher ability secondary school pupils!
A must have recource for all Mathematics teachers!
Subjects:
Grades:
8th - 12th
Types:
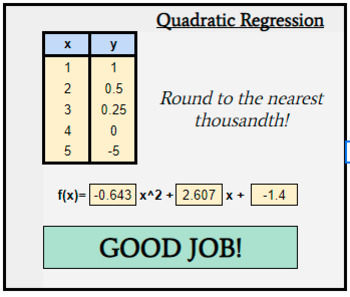
Quadratic Regression Equation Answer Checker
Google Sheets document which will check student answers without showing them the correct one. Perfect for embedding into your schools LMS, or for using in conjunction with my Domination Board Game (always FREE - see my store!).
Subjects:
Grades:
8th - 11th
Types:
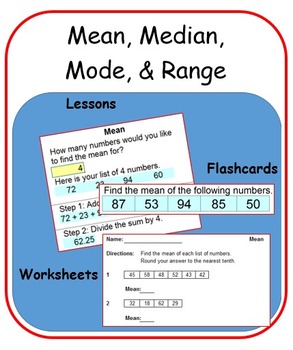
Mean, Median, Mode, & Range
Use the magic of Microsoft Excel to generate countless examples, stimulate discussion, and build student confidence and competence in calculating mean, median, mode, and range.
ALL the work has been done for you! All you have to do is:
1. Open the downloaded Excel file.
2. Click on one of the lesson tabs located at the bottom of the screen.
3. Press the appropriate key(s) to generate an example (F9 for PC; Command + Equal for Macs).
4. Demonstrate, discuss, review, and learn.
5. Then with a si
Subjects:
Grades:
4th - 7th
Types:
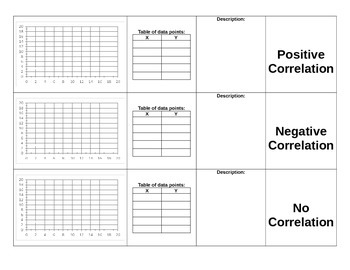
Scatter Plot Sort Activity
This is a graphic organizer/activity. Students have to fill out the graphic organizer that is about positive, negative, and no correlation. After every part of the graphic organizer is complete, the students need to cut out the individual boxes, then they need to mix up the pieces and try to "sort" them back together. After each student has sorted their own, I make them switch with each other and sort a different one. My students love doing this! They enjoy it even more when I make it into a com
Subjects:
Grades:
7th - 9th
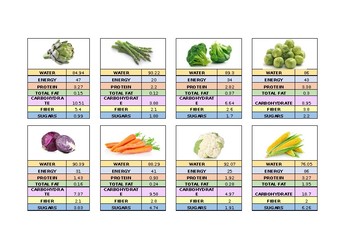
Food Content Cards
SCIENCE
These cards make an excellent hook into the topic of healthy eating if used as Top Trumps game.
COOKING
These cards are useful for healthy eating because it is in the overlap between cooking and science.
MATHS
- Top trumps cards themselves are also useful for number ordering lessons, and they do bring awareness of healthy eating as a cross-curricular link.
- As a more interesting source of information for statistics projects, which rather could be stuck around the room so statistics ga
Subjects:
Grades:
Not Grade Specific
Types:
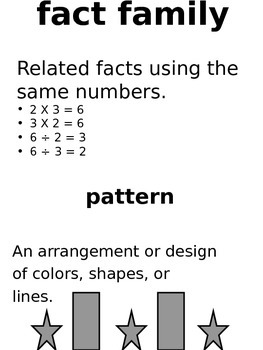
Math Vocabulary Word Wall - Patterns and Statistics
My Math Vocabulary Word Wall is divided into five parts, per objective. There are two words per page. Each vocabulary word is bolded at the top center, and includes a definition and illustration. The Patterns and Statistics sections includes 5 slides. That's 9 words, essential for our students to internalize Patterns and Statistics. Perfect for ELL students and our visual learners!
Subjects:
Grades:
3rd - 5th
Types:
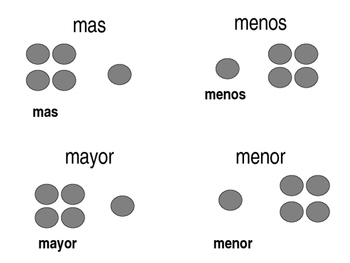
Math Vocabulary Word Wall Statistics - Spanish PK - 2nd Grade
My Math Vocabulary Word Wall is divided into five parts, per objective. This is the statistics section. There are four words per page. Each vocabulary word is bolded at the top center, and includes a definition and illustration on most words. This post included 3 pages, 12 words in Spanish, and is intended for grades PK - 2nd.
Subjects:
Grades:
PreK - 2nd
Math Vocabulary Word Wall Statistics PK - 2nd Grade
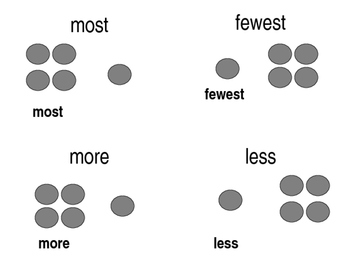
My Math Vocabulary Word Wall is divided into five parts, per objective. This is the statistics section. There are four words per page. Each vocabulary word is bolded at the top center, and includes an illustration on most words. This post included 3 pages, 12 words, and is intended for grades PK - 2nd.
Subjects:
Grades:
PreK - 2nd
Independent vs. Dependent
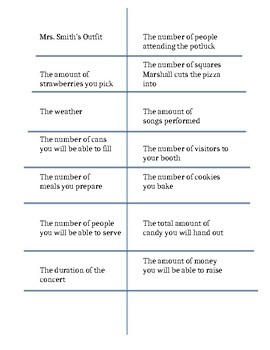
Worksheet for teaching independent and dependent. I used this as a whole group activity to transition into group work. My class had a lot of trouble with understanding this material, but they liked having more examples than the two that were shown in the book. Hope this helps your students as much as it helped my students (and my sanity).
Subjects:
Grades:
5th - 12th
CCSS:
Data Landmark Flashcards/Memory Game
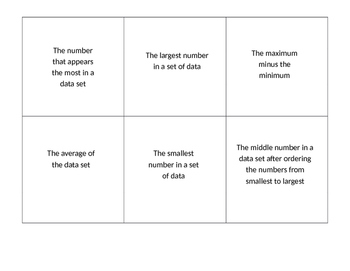
To help students learn data landmark vocabulary (mean, median, mode, range, maximum & minimum) print out these flashcards. They can be two sided for students working on practicing alone or can be printed single sided and used in a memory game! For the memory game I'd print a few versions and students match the definitions to the correct data landmark then keep any pairs they turn over.
Subjects:
Grades:
4th - 8th
Showing 1-15 of 15 results


