
Probability and Statistics (Algebra 2 - Unit 11) | Math Lion


- Zip
Also included in
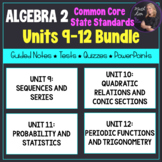 This is a great bundle that covers the last 4 units of an Algebra 2 course. 30 Lessons included!! Check out the preview to view the entire table of contents.Documents are editable!Included:-Common Core State Standards alignment guide-Learning scales for all 30 lessons-82 pages of guided notes withPrice $36.00Original Price $40.00Save $4.00
 88 Lessons included! This is a great bundle that covers concepts for a full year Algebra 2 course. Check out the preview to view the entire table of contents.All files are editable in word or powerpoint! Included:-Common Core State Standards alignment guide (PDF)-Learning scales for all 88 lessons-Price $96.00Original Price $120.00Save $24.00
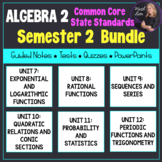 This is a great bundle that covers the second semester of an Algebra 2 course. 42 Lessons included!! Check out the preview to view the entire table of contents.Documents are editable!!Included:-Common Core State Standards alignment guide (PDF)-Learning scales for all 42 lessons-110 pages of guidedPrice $54.00Original Price $60.00Save $6.00
Description
Documents are editable!!!
This unit includes PowerPoint presentations, coordinated guided notes with answers, a mid-unit quiz, and unit test covering Probability and Statistics Functions. The PowerPoint includes warm ups (do-now or bell ringer), key concepts, and examples for students to follow.
10 lessons included! The lessons are 30 - 45 minutes each.
11.1: PERMUTATIONS AND COMBINATIONS
11.2: PROBABILITY
11.3: PROBABILITY OF MULTIPLE EVENTS
11.4: CONDITIONAL PROBABILITY
11.5: PROBABILITY MODELS
11.6: ANALYZING DATA
11.7: STANDARD DEVIATION
11.8: SAMPLES AND SURVEYS
11.9: BINOMIAL DISTRIBUTION
11.10: NORMAL DISTRIBUTION
Unit Essential Questions:
• What is the difference between a permutation and a combination?
• What is the difference between experimental and theoretic probability?
• How are measures of central tendency
