78 results
Graphing assessments for Easel Activities
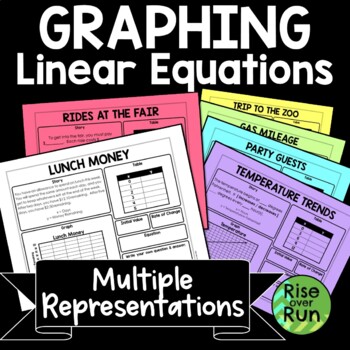
Linear Equations Graphing Worksheets with Multiple Representations
These activity sheets will help students make connections between linear graphs, equations, tables of values, and the stories they represent. This resource is one of my favorites and best sellers! Included are 6 different sheets, each with a different scenario and a different representation given. For example, students may be given an equation, and they must fill in a graph to match, missing parts of the story, a table, and identify the initial value and rate of change. The sheets range in d
Grades:
8th - 9th
Types:
CCSS:
Also included in: 8th Grade Math Activities & Lessons Bundle for the Whole Year
Coordinate Graphing Ordered Pairs Activities - Printable or Google Classroom
Activities and mystery pictures to teach coordinate graphing and ordered pairs so kids can plot points and solve problems on a coordinate plane. Teach your students about graphing in the first quadrant of the coordinate plant with these woodland animal themed pages!**Easy to use for distance learning!** Digital layer already added - Assign in Google classroom with the TpT digital activity tool and kids can draw lines with the pen and enter answers in text boxes.Contents:*Coordinate Plane Vocab A
Grades:
3rd - 5th
Types:
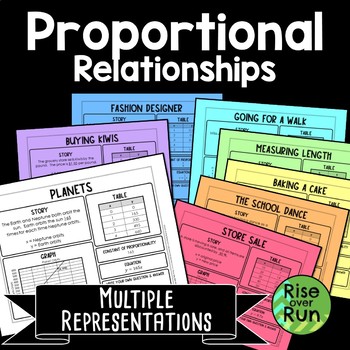
Proportional Relationships Graphing with Multiple Representations
These multiple representation math tasks help students make connections between graphs, tables, equations, and real world scenarios. Students are given a little information and must think how to fill in the rest!8 activity sheets each include: a story a grapha tableconstant of proportionalityan equation a space for students to write their own question and answer. A blank template is included as well so students can create their own proportional relationship.Multiple representations are a great w
Grades:
7th - 8th
Types:
Also included in: 8th Grade Math Activities & Lessons Bundle for the Whole Year
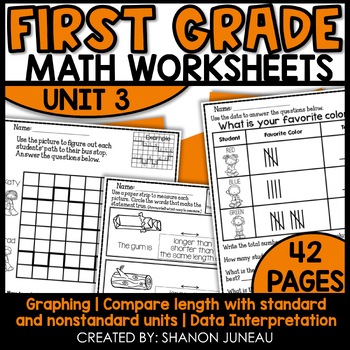
Interpreting Data and Graphing Math Worksheets Bar, Picture Graphs, Tally Charts
These Graphing & Measuring 1st Grade Math Worksheets will help you with graphing, measuring, and working with a simple grid to determine path. These first grade work sheets are perfect for guided instruction, independent instruction, skill reinforcement, and homework. BUNDLED FOR CONVENIENCEYear-long 1st Grade Math Worksheets Save 25%These worksheets cover:measurement (shorter, longer) (shortest, longest)measurement with centimeter cubesgraphing with numbers and tally markscounting pathsbl
Grades:
1st
Types:
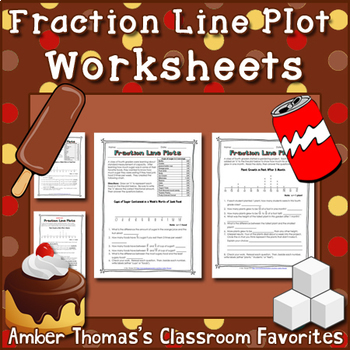
Fraction Line Plot Worksheets
Do your students need more practice learning to make a line plot to display a data set of measurements in fractions of a unit? I know when I went over the Common Core Standards CCSS Math 4.MD.B.4 had me scratching my head. We had NO resources to cover it. So I made my own! These two worksheets use contexts that fourth graders are likely to be familiar with when it comes to measurement units and fractional parts. The types of questions vary between reading a line plot, creating a line plot wi
Subjects:
Grades:
4th - 5th
Types:
Also included in: Fraction Line Plot Bundle
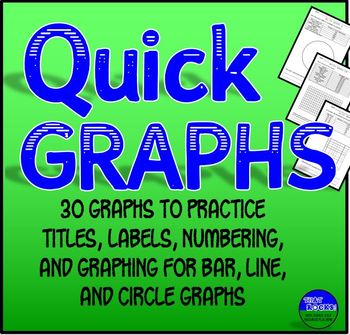
Graphing Practice 30 Quick Graph Sheets for Bar, Line, & Pie Graphs
Graphing Practice for Middle School! These are great to use as bellringers, exit tickets, or just extra practice, and work well for either a science class or math class.Using a data table, students supply the title, label the X- and Y-axes, practice finding appropriate number intervals, and make the graph. My average sixth grade students take 5 - 10 minutes per graph. The half-sheet format saves paper. Now available as ready-to-use EASEL activities!Each data table includes factual informatio
Grades:
5th - 8th
Types:
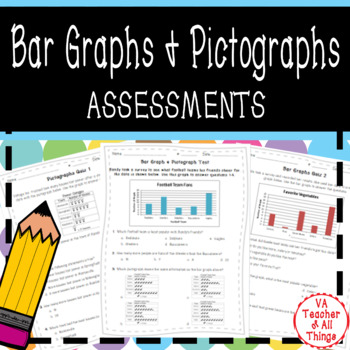
Reading Bar Graphs and Pictographs Assessments SOL 3.15
Test your students' ability to read and create bar graphs and pictographs of varying scales using these 4 quizzes and 1 test. Aligns with Virginia math SOL standard 3.15. Product Includes: Two 6 question quizzes on reading bar graphs (each with one "bonus" 7th question)Two 6 question quizzes on reading pictographs (each with one "bonus" 7th question)One 20 question test on reading and creating bar graphs and pictographs combined (The test is easily printable as two 10-question quizzes or tests i
Subjects:
Grades:
2nd - 4th
Types:
Also included in: Bar Graphs & Pictographs Bundle SOL 3.15
Dilations Initials Project - Project Based Learning with Digital Easel Activity
Dilations Initials Project.This is a culminating project for a unit on dilations. Students enlarge and shrink a drawing of their initials on grid paper or poster-board and use coordinate graphing rules to produce a similar image. In addition, they enlarge the image and it must have a scale factor of at least 4. Then they shrink the image and it must have a scale factor of at most 1/4. Good activity for project-based learning. Digital and Print: Includes an Easel Activity ready for learning with
Subjects:
Grades:
6th - 9th
Types:
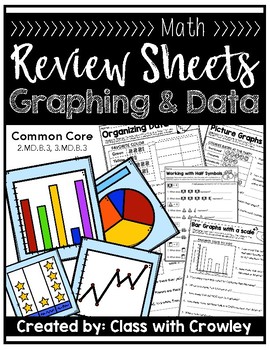
Graphing and Data (Review Sheets)
Easy... no prep... 37 Different review sheets to practice reading and interpreting graphing and data. Collecting data of your ownLabeling different tables, graphs and chartsFrequency Tables•Organizing data from a tally chart into a frequency table•Using a frequency table to answer one step questions•Using a frequency table to answer multi-step questions•Reading and interpreting multi-column frequency tablesPicture Graphs•Reading a picture graph w/no scale•Reading a picture graph w/ a scale•Using
Grades:
2nd - 4th
Types:
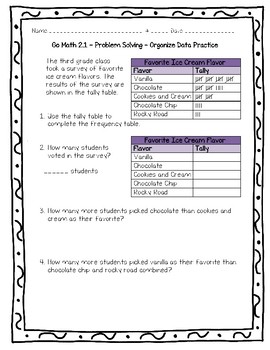
Go Math Practice - 3rd Grade Chapter 2 - Represent and Interpret Data
What's Included
Included in this pack are 9 worksheets on all the lessons in the Go Math book for chapter 2, a midchapter checkpoint practice sheet, and an end of the chapter checkpoint practice sheet.
I try to make each one 10 questions and on 1 page but due to the nature of this chapter (graphs and charts) there may be more or less.
These can be used as a quiz, formative assessment, homework, or just extra practice!
Answer keys are included for each worksheet.
Lesson 1: Problem Solving
Subjects:
Grades:
2nd - 4th
Types:
Also included in: Go Math Practice - 3rd Grade Worksheets For Entire Year Bundle
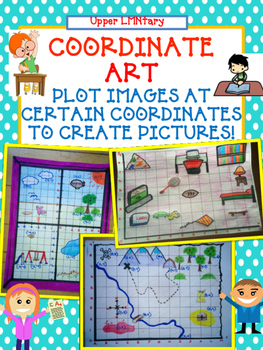
Coordinate Grid Number Line Art Activity - Distance Learning
Coordinate Grid Number Line Art Activity Students will design a scene by creating a coordinate grid/number line. Then students will draw pictures at specified coordinates to create a scene. Included:3 Student Assignment sheets (bedroom, treasure map, and window scenes)2 grid templatesCoordinate Art RubricTons of photos of samplesLet your students be creative and apply what they have learned about coordinates by creating CUTE Art! Use as a group project, home project, assessment or classwork.
Subjects:
Grades:
5th
Types:
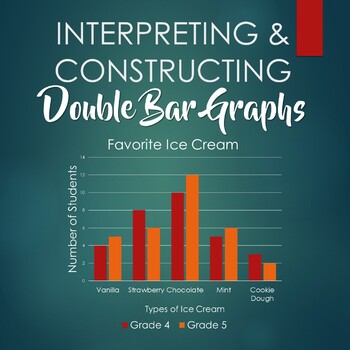
Interpreting and Constructing Double Bar Graphs - Booklet
This booklet includes six worksheets:- 3 double bar graphs for students to interpret- 3 sets of data for students to construct double bar graphs, with corresponding questions- answer key
Subjects:
Grades:
3rd - 6th
Types:
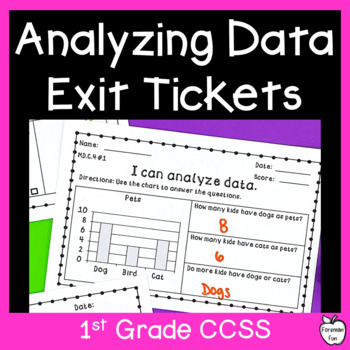
Bar Graph & Tally Chart Exit Tickets - Analyze Data - 1st Grade Math Assessment
Need a quick way to assess student knowledge of data analysis and graphs? This pack includes 8 exit slip assessments on analyzing bar graphs and tally charts. There are 4 exit tickets on bar graphs and 4 on tally charts. These are perfect to use as a quickcheck for student understanding after a lesson. You could also use one exit slip as a pre-assessment to make your guided groups. Then use a different one as a post-assessment to show growth and identify any students who may need reteaching. The
Grades:
K - 2nd
Types:
CCSS:
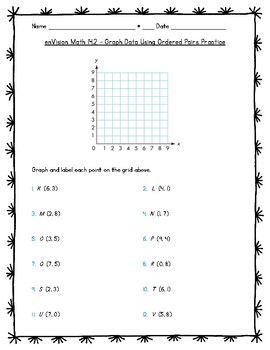
enVision Math 5th Grade - Topic 14 - Graph Points on the Coordinate Plane
Please note this is for both editions of enVision Math. 2016 and 2024.What's IncludedIncluded in this pack are 4 worksheets on all the lessons in the fifth grade enVision Math book for Topic 14 - Graph Points on the Coordinate Plane.These can be used as a quiz, formative assessment, homework, or just extra practice!Answer keys are included for each worksheet. ★Lesson 1: The Coordinate System★Lesson 2: Graph Data Using Ordered Pairs★Lesson 3: Solve Problems Using Ordered Pairs★Lesson 4: Reasoning
Grades:
5th
Types:
Writing, Graphing & Solving One-Step Inequalities - Distance Learning Options
This worksheet, available as a PDF or Digital Worksheet, includes questions on writing, graphing, and solving one-step inequalities. Students need to translate verbal phrases, including one word problem; graph inequalities on the number line; write inequalities given a graph; and solve one-step inequalities involving addition, subtraction, multiplication, and division. Problems include positive and negative numbers along with several fractions and decimals. There are no inequalities where st
Subjects:
Grades:
5th - 7th
Types:
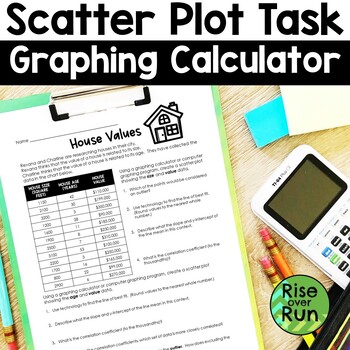
Scatter Plot Worksheet with Graphing Calculator Practice
Need a real world scatter plot activity where students use their graphing calculators? Grab this activity and help your students understand lines of best fit and calculating correlation coefficients!Students are given data on house sizes, house ages, and house values. They use a graphing calculator or computer program to plot the points and answer questions that follow.This is a great activity for partners to explore or for individual work. It can lead to some great math discussions!Answer key
Subjects:
Grades:
8th - 9th
Types:
CCSS:
Also included in: Algebra 1 and 8th Grade Math Curriculum Bundle for Entire Year
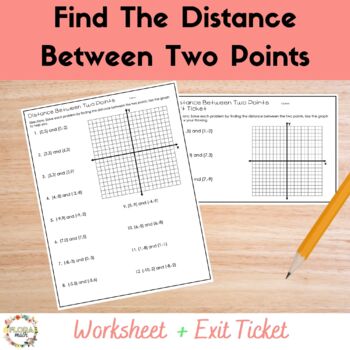
Distance on the Coordinate Plane Worksheet and Exit Ticket
Do your students need more practice finding the distance between 2 points on the coordinate plane? Try this worksheet and exit ticket pairing. Both activities are focused on distance between points with only vertical or horizontal change (no Pythagorean theorem required). Both the worksheet and the exit ticket have coordinate grids that students can use for problem solving or showing their thinking. The activities are ready to just print and use, and they are closely aligned.Hope you enjoy them!
Grades:
6th
Types:
CCSS:
ACT Math Test Prep for Algebra Geometry Number Sense
This ACT math resource has 26 questions covering the following topics: functions, algebraic and geometric transformations, graphing, exponent rules, slope, midpoint, quadratic formula, geometric sequences and more! The answer key comes with explanations for each problem! Standards are included so student can determine weaknesses. If you want a combination of SAT, PSAT, ACT and ACCUPLACER and TSI, then check out the Mega Bundle below:COLLEGE TEST PREP MEGA BUNDLE - 3 BUNDLES IN ONE!Copyright © Ti
Grades:
9th - 12th, Higher Education, Adult Education
Types:
Also included in: ACT Math Test Prep Bundle
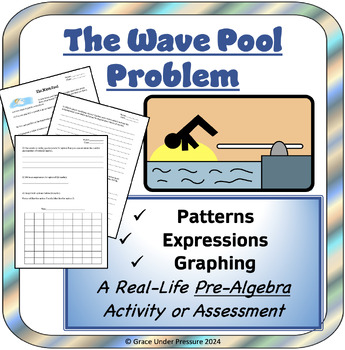
Wave Pool Patterns, Expressions, Graphing: Real-Life Pre-Algebra Problem Gr 5-7
Here is a ready-to-print real world math activity for a pre-algebra unit in grades 5-7 including expressions, tables of values, and graphing. • This activity lets students explore pattern rules, expressions, and line graphs using a real-life scenario that is of interest to them: getting the best deal on a pass to a local wave pool.• Read through the activity as a class after you have been working on a patterning or pre-algebra unit.• This can be used as an in-class assignment, weekly homework ta
Subjects:
Grades:
5th - 7th
Types:
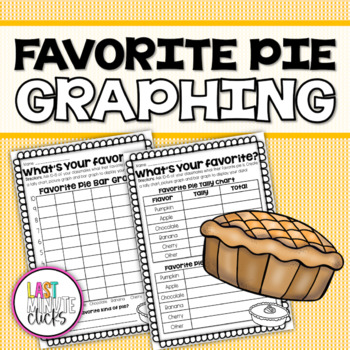
Favorite Pie Graphing Activity - Tally Chart, Picture Graph and Bar Graph
Favorite Pie Graphing Activity - Tally Chart, Picture Graph and Bar GraphThis Favorite Pie Graphing Activity will keep your students engaged and excited about graphing data! First, students will go around the classroom and survey their classmates by asking the question: "What is your favorite kind of pie?" Students will tally up the data on a tally chart. Then, students will record their findings and data on a picture graph and bar graph! Students will love learning about and relating to other s
Subjects:
Grades:
1st - 4th
Types:
CCSS:
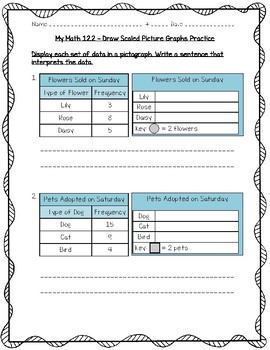
My Math - 3rd Grade - Chapter 12 - Represent and Interpret Data Worksheets
What's Included
Included in this pack are 8 worksheets on all the lessons in the third grade My Math book for Chapter 12.
These can be used as a quiz, formative assessment, homework, or just extra practice!
Answer keys are included for each worksheet.
Lesson 1: Collect and Record Data
Lesson 2: Draw Scaled Picture Graphs
Lesson 3: Draw Scaled Bar Graphs
Lesson 4: Relate Bar Graphs to Scaled Picture Graphs
Lesson 5: Draw and Analyze Line Plots
Lesson 6: Hands On: Measure to Halves and Fou
Subjects:
Grades:
3rd
Types:
Also included in: My Math 3rd Grade Worksheets - Entire Year Bundle
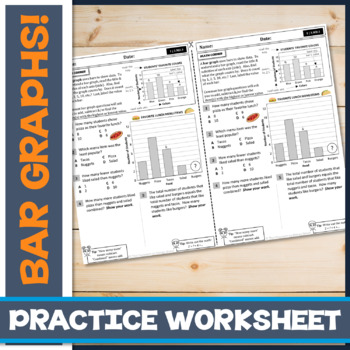
Interpreting Bar Graphs to Solve Word Problems: Exit Slip/Ticket
This is a quick, scaffolded drill on interpreting bar graph data to solve single and multi-step math problems. Use as guided and independent practice, or assign as homework/an exit slip to assess student mastery. This drill has a mini-lesson at the top, followed by 5 questions and originally comes from a larger unit designed to teach third graders Graphs Inside Out!This drill is a half-page, with two of the same activities fitted per page to save on printing. BOOST YOUR MATH TOOLKIT! Bar G
Subjects:
Grades:
3rd - 4th
Types:
CCSS:
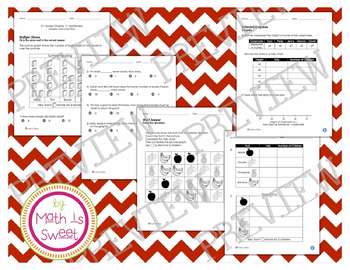
Math In Focus - Grade 2 - Chapter 17 (Graphs and Line Plots) Review/Test
This is a review of the test from Chapter 17 of Math in Focus 2nd grade (2015/2018 edition). This review mimics the "Test Prep" from the assessment book and makes an excellent review for the test. It can be sent for homework, or completed in class.This also makes an excellent 3rd grade review or reteach.Answer key included.If your test prep includes something that is not in this study guide, please let me know and I can update your file.Save by getting the BOOK B BUNDLE and also get the EOY Asse
Subjects:
Grades:
2nd - 3rd
Types:
Decimals Project based learning Monster Ice Cream Parlor
Welcome to The Monster Ice Cream Parlor Decimal focused project-based learning! In this student-tested and approved project, students jump into ownership of the monster ice cream parlor. They create flavors, set prices, and graph their sales all while practicing adding, subtracting and multiplying decimals, and graphing. Included in this ready to use project:- Student pages for building a monster ice cream parlor- Student pages for calculating revenue- Student pages for graphing revenue and s
Subjects:
Grades:
4th - 6th
Types:
Also included in: 6th grade math MEGA resource bundle
Showing 1-24 of 78 results


