28 results
Graphing laboratories for Google Apps
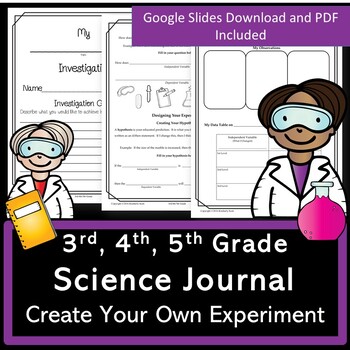
Science Experiment Journal Template | Digital Or Print | Grades 3 4 5
Are you looking to create hands-on investigations with your upper elementary students? Help students think like a scientist using a lab report template. Included are a student-editable Google Slide document and a PDF version. We will take you step by step in designing unique experiments on the topic of your choice. A Google Slide version is included. We feel this journal is great to assign students to perform an experiment at home. During this time of digital learning, students can use suppli
Subjects:
Grades:
3rd - 6th
NGSS:
3-5-ETS1-3
Scientific Method NGSS Crosscutting Concepts Activity & PowerPoint
Students will have a great time learning about science skills, experimental design, NGSS Cross Cutting Concepts, and NGSS Science and Engineering Processes with this resource! And it's Google Ready! It's packed with teacher notes to make your job easy!All you need are two tennis balls per group, one meter stick per group and something to keep the tennis balls cold like a cooler or freezer. The data really shows the difference between the bounce of a cold tennis ball and a room temperature ball.
Subjects:
Grades:
5th - 12th
Types:
MS-PS4-1 Mathematical Models of Waves Lab | Printable, Digital & Editable
About SNAPs Lab Stations ActivitiesSNAPs Lab Stations Activities require students to use science, math, literacy, problem-solving and engineering skills. They are designed to enhance students' understanding of scientific concepts and help students apply scientific ideas to the real world. Each station activity promotes skills so to develop students into proficient and competent scientific thinkers.SNAPs lab activities have five components:• Science Skills Station to develop science skill profici
Subjects:
Grades:
5th - 9th
Types:
NGSS:
MS-PS4-1
Also included in: Physical Science Lab Stations Bundle | Printable, Digital & Editable
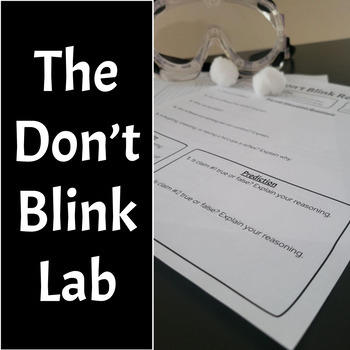
Don't Blink Lab (Reflexes, Nervous System, Data Collection, etc.)
This is a fun lab for students to test their ability to control a reflex like blinking. It works by having the students wear safety goggles and having their partner toss a cotton ball toward their eyes while they try not to blink! It's ton's of fun! The lab handout includes the following:Pre-Lab Discussion Questions Claims About Blinking As A Reflex and Blinking With Both EyesHas Students Make A Prediction Record Personal Data & Calculate AverageCollect & Graph Classroom DataAnalyze L
Subjects:
Grades:
7th - 10th
Types:
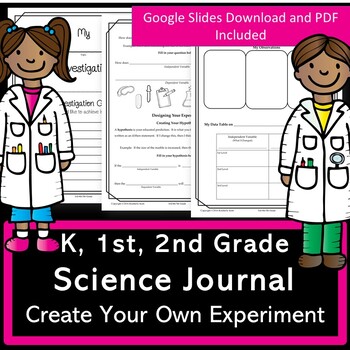
Science Experiment Journal Template | Digital Or Print | Grades K, 1st, 2nd
Create a memorable scientific experience. This blank science experiment template assists adults and students in working together to create a hands-on investigation. Included are a student-editable Google Slide document and a printable version. We will guide you step by step to think like a scientist. We feel this is great for distance learning. This journal is excellent for assigning students to perform an experiment at home. During this time of digital learning, students can use supplies t
Subjects:
Grades:
K - 2nd
NGSS:
K-2-ETS1-3
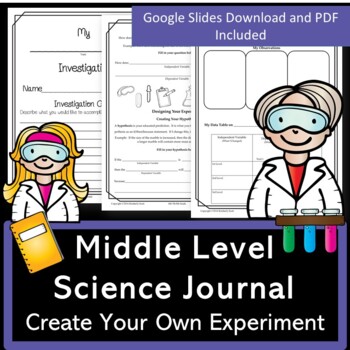
Science Experiment Journal Template | Digital Or Print | Grades 6 7 8
Are you looking to create hands-on investigations with your middle-level students? Help students think like a scientist using a lab report template. Included are an editable Google Slide document and a PDF version. We will take you step by step in designing unique experiments on the topic of your choice.A Google Slide version is included. We feel this journal is great to assign students to perform an experiment at home. During this time of digital learning, students can use supplies they have
Subjects:
Grades:
6th - 9th
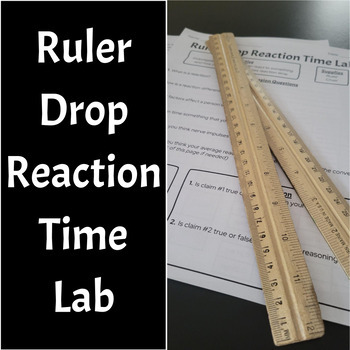
Ruler Drop Reaction Time Lab (Data Collection & Nervous System)
This is a fun lab for students to test their reaction times using the ruler drop method. The lab handout includes the following:Pre-Lab Discussion Questions Claims About Reaction Time & Dominant vs. Non-Dominant HandHas Students Make A Prediction Record Personal Data & Calculate AverageCollect & Graph Classroom DataAnalyze Lab SectionBackground Information Section (Only Briefly Explains The Biology of Reaction Times)PDF & Editable Copies IncludedFollow My Store By Clicking Here
Subjects:
Grades:
7th - 10th
Types:
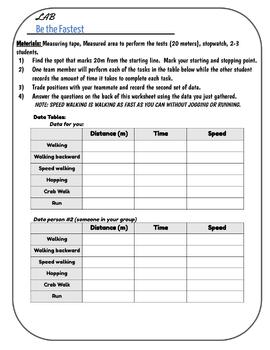
Velocity Lab
An interactive lab that teaches students how to measure speed doing different activities, how to calculate distance, time, or speed, and how to graph that data.
Subjects:
Grades:
7th - 12th
Types:
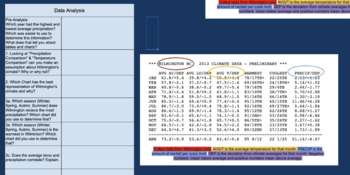
virtual lab collect digital weather data to analyze Climate
Use real data to illustrate weather's relationship with Climate. This data provides the foundation for discussion on the four seasons as well as natural weather events such as hurricanes, El Nino, La Nina, and how it pertains to the North Carolina coast and surrounding states. Each collection, supported by NOAA, provides detail weather data for each month but also a detailed summary of the events from that year. The activity allows for groups or individuals learn the process of collecting month
Subjects:
Grades:
5th - 10th
Types:

Heartbeat Performance Task
Simple class activity to encourage students to evaluate the efficacy of aerobic exercises. Students should be comfortable with data collection, graphing, and writing a summary with a conclusion. Includes task and assessment list.To student: Your job is to collect some data on how aerobic exercises influence your body's cardiovascular system. You will measure the influences that during one minute of two different aerobic exercises, have on the rate of your heartbeat, and use a bar graph to displa
Grades:
6th - 8th
Types:

Forensic Scientist Performance Task
A good introduction lab to the methodology of forensics. Students should have an understanding of data collection, chart and graph construction, and writing conclusions.No materials beyond metric meter sticks are required.
Subjects:
Grades:
6th - 8th
Types:
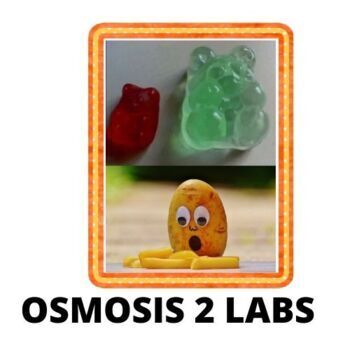
OSMOSIS Gummy Bear and Potato lab
Here are TWO labs to teach your High school science students about osmosis. Your students will enjoy earning the process of osmosis in these guided labs. The first lab is the classic gummy bear lab to see how the bear increases in size. In the second lab your students will use real plant cells to see osmosis. Lessons include1. Gummy Bear lab2. Potato lab3. A outline of how osmosis affects life on our planetBe the first to know about my new discounts, freebies, and product launches: Look
Subjects:
Grades:
8th - 11th
Types:
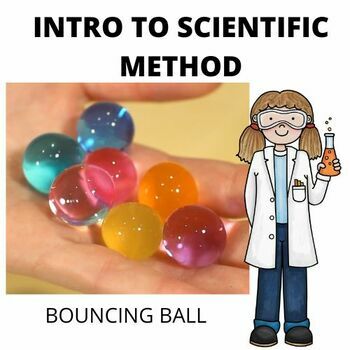
Scientific method Bouncing ball lab Independent and Dependent Variable
Students communicate their observations and the experiment results through discussion, writing, and drawing. This is a great introductory lesson to improve their ability to follow directions and conduct experiments.Are you looking for a terrific lesson to teach the following objectives1. Scientific method2. GraphingNo prep and no cleanupGet ready to WOW your students with this simple yet highly engaging science experiment. Bouncing Polymer Ball! introduces students to two key concepts of physi
Subjects:
Grades:
7th - 10th
Types:
NGSS:
MS-PS2-2
Dish Soap Bubble Lab and Class Discussion
This lab can be used in the beginning of the school year to help break the ice in the classroom and to investigate how soap affects the surface tension of water. There will be three different soaps selected by the teacher from the dollar store. There are class discussions, collaborative work and research. Each lab group of three will test the efficiency of each soap by measuring bubbles created with each type of soap and determine which soap makes the best bubbles.
Grades:
6th - 9th
Types:
Physics Lab--Making Graphs
In this product, students will use spaghetti to study the relationship between the Independent Variable and Dependent Variable in a controlled experiment. They will compare the numbers of strands of spaghetti verses the mass they held and graph the data to use the slope of the line to discover the relationship between variables and to interpolate and extrapolate data from the graph. Students will learn how to use the information gained from the graphs to predict points on the graph. This is a
Grades:
8th - 12th
Types:
Also included in: Experimental Design Unit Physics
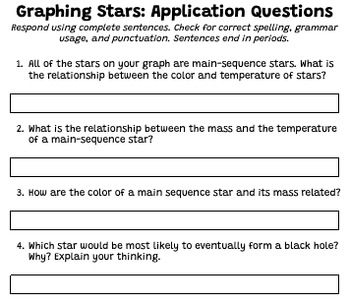
Graphing Stars - Application Questions
Four application questions help students make sense of their graphed star data and apply it to predicting a black hole. Can be used digitally or printed. Answer key is separate.
Subjects:
Grades:
7th - 12th
Types:
Also included in: Graphing Stars - Graphing Lab & Questions BUNDLE
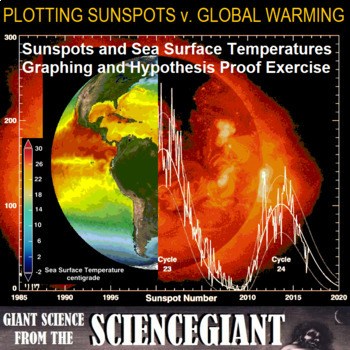
Graphing Lab Activity: Plotting Sunspots vs. Global Warming (GOOGLE SHEETS ver)
Graphing Lab Activity: Plotting Sunspots vs. Global Warming (GOOGLE SHEETS version)The Sun is the source of Earth's surface energy, so what happens when it maxes out? What danger is the Sunshine State in when the Sun peaks its activity cycle with more sunspots, solar flares and UV rays? Using real-time data from the internet and graphing calculators or spreadsheets, participants will find what pattern(s) emerge at solar maximum when sunspot numbers are time-plotted, and how Earth reacts to a sc
Subjects:
Grades:
7th - 12th
Types:
NGSS:
HS-ESS2-4
, HS-PS3-4
, HS-ESS3-1
, HS-ESS1-1
, HS-ESS3-5
...
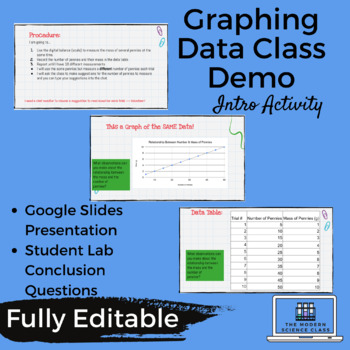
Introduction to Graphing Data - Demo or Lab
Students often don't understand the purpose of collecting data in both tables and graphs. Why not make this the question that they need to investigate.... How can graphing help us interpret lab data? Use this SIMPLE, low-cost activity as either a class demo (hello virtual learning) or small group lab. In this activity students will investigate the relationship between mass and number of pennies in a data table and graph. This resource contains: - A Google Slides presentation walking students &am
Grades:
4th - 8th
Types:
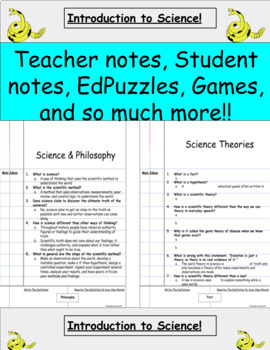
Distance Learning Introduction to Scientific Thinking Interactive Notebook
Help your students understand the history and philosophy behind the scientific method! Includes: Rock-Paper-Scissors Lab (perfect for distance learning) Thumb war lab Premade Quizizz Game with 50 QuestionsPremade Quizlet Study Set 35 Vocabulary Words Premade Gimkit Study Set 35 Questions2 Distance Learning/Flipped Classroom LabsGoogle Classroom Editable Assisted Cornell Style NotesI can objectivesBased on the 5E model 3 Premade EdPuzzles aligned with the notes! These past two weeks of distance
Subjects:
Grades:
7th - 10th
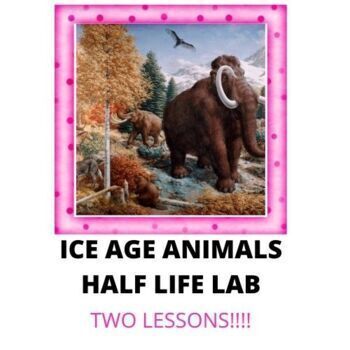
Ice age animals and Half-life lab Middle School science virtual field trip
This product contains two lessons. The first is a virtual field trip to see the animals of the Ice Age. Google slides The second section is a lab that helps students understand the radioactive principle of half-lives. Students shake a shoebox of pennies that are all heads-up. They remove pennies that end up tails up after each round. Data is entered into a table The answer key is providedMaterials100 PENNIESSHOEBOXPENCIL AND PAPERCLOCK WITH SECOND HANDSAFETY GOGGLES
Subjects:
Grades:
7th - 9th
Types:
NGSS:
MS-LS4-1
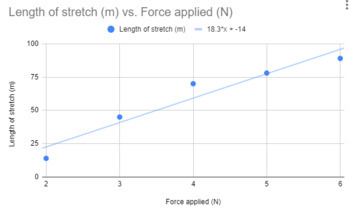
Hooke's Law graphing lab
Simple STEM focussed activity to teach Hooke's law. Students will collect data, and analyze it graphically. The lab looks at solving Hooke's law problems by graphing data and then using the graph to solve problems about each specific spring. Some basic spreadsheet skills are also taught with this exercise, as students use Google sheets to develop and analyze their graphs.There is minimal set-up required, and not much equipment is needed. Teachers will only need 5 different "springs" (rubber band
Subjects:
Grades:
9th - 12th
Types:
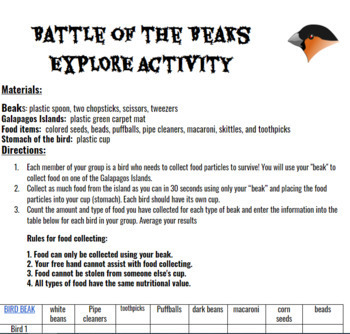
Darwin's Battle of the Beaks-Natural Selection
In this lesson students complete an ENGAGE activity comparing different spoons and identifying each spoon's structure and function. In the EXPLORE activity students receive a "beak," either scissors, chopsticks, tweezers, or a spoon and collect different food items from a plastic grass carpet. Students collect data, input data into a google sheet, make a graph to display the data, and formulate conclusions through short answer essay questions in their google doc lab report. Students use mathe
Grades:
8th
Types:

Experimental Design and Graphing; Case Study: For the Sake of Water
Students in this activity will build and analyze a graph from an experiment that a girl conducts in an attempt to sway the city council to tighten restrictions on watering. Students will analyze a problem and experiment for variables, build a graph, and analyze how the data that this girl has collected translates to a recommendation to the city.
Subjects:
Grades:
5th - 8th
Types:
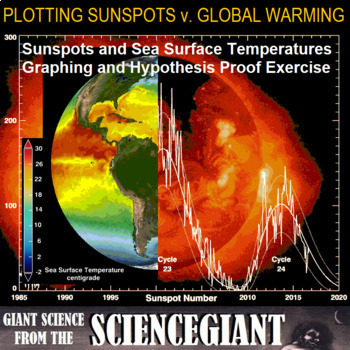
Graphing Lab Activity: Plotting Sunspots vs. Global Warming (GOOGLE DOC version)
Graphing Lab Activity: Plotting Sunspots vs. Global Warming (GOOGLE DOC version)The Sun is the source of Earth's surface energy, so what happens when it maxes out? What danger is the Sunshine State in when the Sun peaks its activity cycle with more sunspots, solar flares and UV rays? Using real-time data from the internet and graphing calculators or spreadsheets, participants will find what pattern(s) emerge at solar maximum when sunspot numbers are time-plotted, and how Earth reacts to a scorch
Subjects:
Grades:
7th - 12th
Types:
NGSS:
HS-ESS2-4
, HS-PS3-4
, HS-ESS3-1
, HS-ESS1-1
, HS-ESS3-5
...
Showing 1-24 of 28 results


