12 results
Graphing laboratories for Microsoft PowerPoint
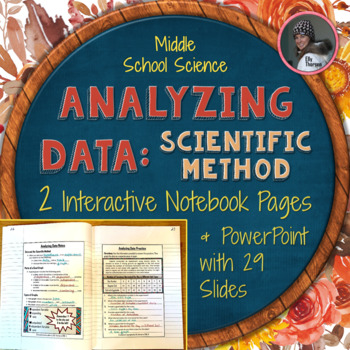
Analyzing Data Interactive Notebook Pages & PowerPoint for the Scientific Method
This middle school science resource has two interactive notebook pages and a 29 slide PowerPoint about analyzing data and making good graphs in the scientific method. The INB pages and PowerPoint emphasize these important graphing concepts:a title that's a combination of the independent and dependent variablesan x-axis label that contains the independent variablea y-axis label that contains the dependent variableaccurate intervals on graphsthe purposes and uses of bar graphs, line graphs, and pi
Subjects:
Grades:
5th - 8th
NGSS:
MS-ETS1-3
Also included in: Scientific Method Interactive Notebook Pages and PowerPoint BUNDLE
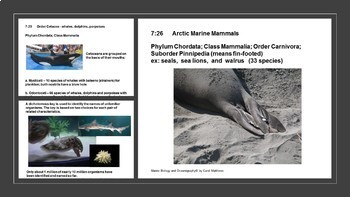
Polar Seas - Ocean/Marine Biology Unit 7
Polar Seas are unique habitats that influence climate and account for the diverse characteristics of polar animals such as Pinnipeds, Cetaceans and Penguins. They will use technology research skills, practice graphing from a computer program such as Excel, and to use photoperiods as a predictor to hemisphere location. Taxonomy is review by having students develop their own dichotomous key.Unit curriculum includes these bookmarked sections:IntroductionStudent SyllabusTeacher Pacing guideLesson Pl
Subjects:
Grades:
10th - 12th
Also included in: Marine Biology and Oceanography Full Year, 12 Unit Bundle
Flip Book Transformation Project
Students create a flip book using Power Point to discover and/or apply properties of geometric transformations. The student handout provides detailed instructions on how to create the flip book which includes using the “duplicate slide” feature in Power Point. Students are required* to create a minimum of 10 slides with 4 different movements. Students are given the opportunity to choose what type of movements they use within given parameters. This choice provides the opportunity for great di
Grades:
7th - 10th
Types:
Also included in: Transformations Bundle
Physics Lab Kinetic, Potential, Graphing, Measurement 6th 7th 8th Middle School
This hands on lab titled physics Olympics was created for middle school and early high school students and is the culmination of the physics unit I teach to my middle school students. Students travel to various stations to get actual hands-on practice of physics concepts, as well as measurement and graphing review. Students go through various Olympic “events” like a discus throw with a paper plate, etc. Concepts covered include kinetic energy, potential energy, getting mass using a triple beam b
Grades:
6th - 9th
Types:
bar graph pie graph graphing thermometer lab PowerPoint STEM 3 4 5 6 TX TEKS
This fun, hands-on, lab and graphing activity gets your students thinking deeply and putting their knowledge of graphing, gathering data, and following instructions to the test. Perfect for test prep! Great way to incorporate science, technology, engineering, and math (STEM) concepts into a fun lesson. This lesson was created for elementary and middle school students and is great practice to help students reinforce the concepts of graphing, data gathering, creating bar graphs, creating pie graph
Subjects:
Grades:
3rd - 6th

6th Grade Science Bellringer (Do Now) Semester 2
These slides are warmups or 'bellringers' for the second semester of 6th grade Science. They cover the following TEKS (objectives for Texas Science): 6.8b Unbalanced Forces, 6.8d Graphing Changes in Motion, 6.8e Inclined Planes and Pulleys Change Force Needed to Move an Object, 6.11b Gravity is the force that governs the motion of our solar system, 6.11a Describe the physical properties, locations, and movements of (objects in our solar system), 6.11c Space Exploration, 6.10a Earth Structures,
Subjects:
Grades:
6th
Scientific Method with Presentation of Data, a student-guided discovery
This PowerPoint presentation details the steps of scientific method, and goes into details about each step, including how to come up with a hypothesis, variable, and control, as well as presentation of data in graphs, bar charts, and and tables, creating one from scratch. It also includes detailed lecture notes and worksheets, along with the answer sheets, instructions for writing a lab report, and an exciting teacher-guided self-discovered experiment that demonstrates to students the way to com
Subjects:
Grades:
7th - 10th
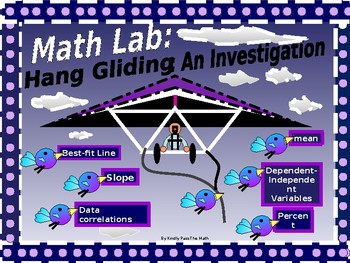
Math Lab An Algebra Review Via Hands-on Glider Investigation
Please join me in my enthusiasm for Math Lab Investigating Gliders!The lab is a two day event that covers and reviews multiple concepts covered in Algebra I, semesters I and II* It is outstanding for bringing concepts back to students prior to finals and for assisting them in applying mathematics to real life situations.* This 50 page investigation requires the student to address the relationship between the wing-span of a glider and the distance that it can fly.* On day one, students work in
Subjects:
Grades:
7th - 12th, Higher Education, Adult Education
Types:
Astronomy Micro Match Rockets Grade 8-10 Chemistry and Physics lab
Objective Students will create a collection of match head rockets and determine the effect of the mass of gas generated on the horizontal distance it flies. Here's how to make rockets, that shoot over 40 feet, with aluminum foil and wooden matches. These desktop rockets might be tiny, but they’re impressively powerful, and leave a cool trail of smoke. Surprisingly, they’re only powered by one single match head. WARNING: Although these rockets are only fueled by one match head, they do get hot
Subjects:
Grades:
8th - 10th
Types:
NGSS:
HS-PS2-2
, HS-PS2-1
Also included in: Astronomy light, planets sizes , space rocket and sun tracking
Apple Oxidation Experiment - Editable Version
Apple Oxidation Science ExperimentWhy do apples turn brown?Quench your child's curiosity with this simple and fun experiment.With your purchase you will receive editable and non-editable labels (control apple/ water/ lemon juice/ milk/ oil/ vinegar) as well as editable and non-editable recording charts to list your child's observations over a lapse of 8 days. (starting with Day 0)Do not forget to leave a review so that I may serve you better in the future.Please remember that everytime you leave
Grades:
K - 2nd
Report writing for students
You can view the images and hear my narration at YouTube URL
https://youtu.be/7HeXCH_rDMY
Copyright (C) Peter Rony 2015 All rights reserved.
I am a chemical engineering educator by profession. This PDF is an important STEM activity that is targeted for teachers starting at level 3 and continuing to level 12. It is not sufficient to have just a laboratory course. As much as possible, students should obtain quantitative “data” as a result of their experiments -- and not just qualitativ
Subjects:
Grades:
3rd - 12th
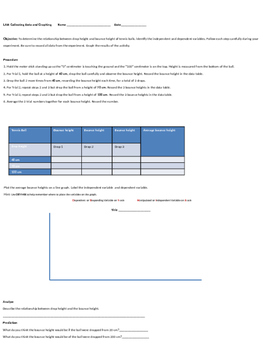
Collecting Measurement Data and Graphing
The purpose of this activity is to collect data for measurement and graph the information. Students can also convert from one unit in the metric system to another, of convert from metrics to customary.
Subjects:
Grades:
5th - 6th
Types:
CCSS:
Showing 1-12 of 12 results


