5 results
3rd grade graphing interactive notebooks for Easel
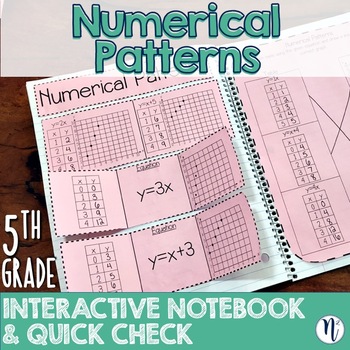
Numerical Patterns Interactive Notebook Activity & Quick Check TEKS 5.4C 5.4D
This interactive notebook activity and quick check assessment covers TEKS 5.4C: Generate a numerical pattern when given a rule in the form y=ax or y=x+a and graph and TEKS 5.4D: Recognize the difference between additive and multiplicative numerical patterns given a table or graphNote: These interactive notebook activities were designed to be completed on paper. However, I have enabled the “TpT Digital” option in case teachers want to convert the quick check assessment page and assign to their di
Subjects:
Grades:
3rd - 5th
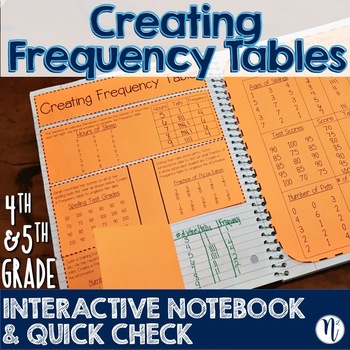
Creating Frequency Tables Interactive Notebook & Quick Check TEKS 4.9A & 5.9A
This interactive notebook activity and quick check assessment covers creating frequency tables under TEKS 4.9A: Represent data on a frequency table, dot plot, or stem‐and‐leaf plot marked with whole numbers and fractions and TEKS 5.9A: Represent categorical data with bar graphs or frequency tables and numerical data, including data sets of measurements in fractions or decimals, with dot plots or stem‐and‐ leaf plotsNote: These interactive notebook activities were designed to be completed on pape
Subjects:
Grades:
3rd - 5th
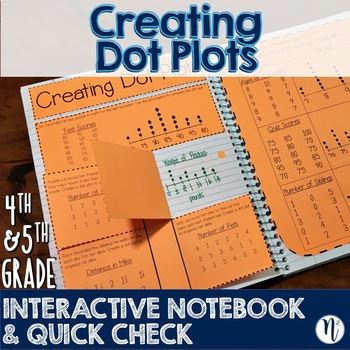
Creating Dot Plots Interactive Notebook Activity & Quick Check TEKS 4.9A & 5.9A
This interactive notebook activity and quick check assessment covers creating dot plots under TEKS 4.9A: Represent data on a frequency table, dot plot, or stem‐and‐leaf plot marked with whole numbers and fractions and TEKS 5.9A: Represent categorical data with bar graphs or frequency tables and numerical data, including data sets of measurements in fractions or decimals, with dot plots or stem‐and‐ leaf plotsNote: These interactive notebook activities were designed to be completed on paper. Howe
Subjects:
Grades:
3rd - 5th
CCSS:
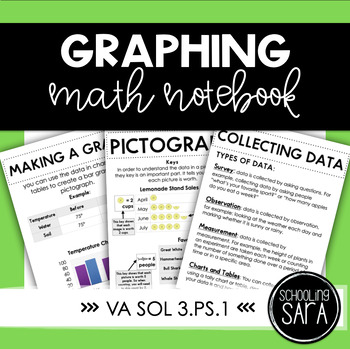
Graphing Math Interactive Notebook | Virginia SOL 3.15 | Digital & Print
This interactive notebook is geared towards Virginia SOL 3.15 which is graphing, with a focus on bar graphs and pictographs. It includes a digital version for paperless classrooms and instructor slides to aid in classroom instruction.Included in this interactive notebook are the following topics:vocabularycreating and reading a bar graphcreating and reading a pictographhow to collect datacreating and reading charts and tablestally charts and tally marksanswering questions about graphsLike what y
Grades:
3rd
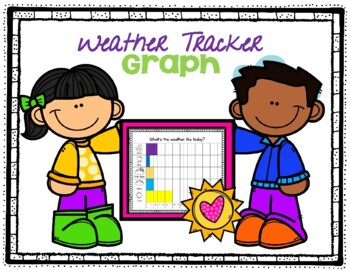
Weather Tracking Graph
Add this weather tracking graph to your morning work binder to help keep track of the weather throughout the month.
Grades:
PreK - 3rd
NGSS:
K-ESS2-1
Showing 1-5 of 5 results


