Graphs Bundle: Scaled Bar Graphs, Pictographs, and Line Plots
- Zip
- Easel Activity
- Easel Assessment

What educators are saying
Products in this Bundle (5)
Description
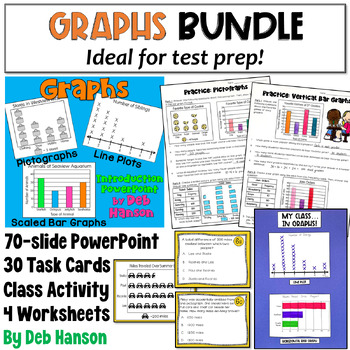
This graphing bundle has everything you need to teach third and fourth-grade students about representing and interpreting data. The activities in this math bundle make learning how to interact with common types of graphs fun and easy! Students love the activities while teachers love the convenience of these no-prep resources that can be used year after year! These graphing activities can be used for test prep, review, or introduction of math concepts related to graphing.
The activities in this bundle focus on the following graphing skills:
→ defining data and survey
→ defining pictographs, bar graphs, and line plots
→ using and creating tally charts and frequency tables
→ interpreting and drawing scaled picture graphs (pictographs)
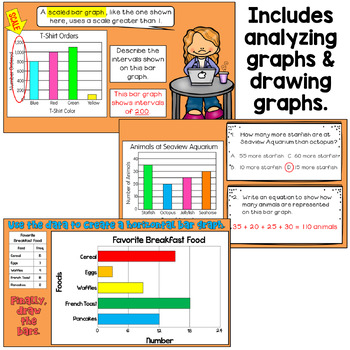
→ interpreting and drawing scaled bar graphs
→ relating bar graphs to scaled picture graphs
→ analyzing and drawing line plots
→ displaying measurement data on line plots
What's included... To gain a better idea of everything included, please check out the individual PREVIEW for each resource:
- Ideal for introducing this topic to students!
- Many multiple-choice practice questions; ideal for test prep!
- You have my permission to convert this to Google Slides, if you wish.
- It comes with a matching 6-page companion handout (The companion handout includes both a printable version and a Google Slides version.)
- 10 graphs; 3 multiple-choice questions follow each graph
- 3 vertical scaled bar graphs, 2 horizontal scaled bar graphs, 3 scaled picture graphs, and 2 line plots
- You get to choose whether to use the printable version, the Google Slides version, the Google Forms version, or the Easel version.
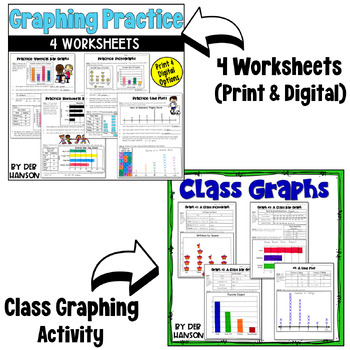
- Students gather data from their classmates.
- They use their data to create a scaled picture graph, a horizontal bar graph, a vertical bar graph, and a line plot.
4 Worksheets (with answer keys)
- Each worksheet focuses on one of the following topics: Pictographs, Horizontal Bar Graphs, Vertical Bar Graphs, and Line Plots.
- In Part 1 of each worksheet, students are given a graph, and they must interpret the data and answer 3-4 questions.
- In Part 2 of each worksheet, students are given data, and they must draw a graph that represents the data.
Here's what teachers like you have to say about using these graphing activities with their elementary students:
⭐️ Kristy R. said, "This was a fantastic resource to help my students understand all things graphing. It was straightforward for my kids to follow. I love the companion worksheets to keep my kids engaged and the creativity to round it all out."
⭐️ Justin M. said, "Great resource! My 3rd graders loved this. Very easy for them to use and no prep for me. Great way to quickly teach this content at the end of the year."
⭐️ Randy P. said, "The students very were engaged, and thoroughly enjoyed this activity. It took no time at all to get the activity started which is what stood out for me as a teacher. Needing as little preparation as possible when utilizing an activity can make a teacher's day, especially in special education. All in all, this resource helped my students strengthen their math skills across the board."
⭐️ Jenna L. said, "My students loved this resource, and the graphics were wonderful to help my students with disabilities really see good visual representation of different graphs. We had so much fun with this unit, and I absolutely love all of Deb's math PowerPoints. They're a lifesaver."
⭐️ Rebecca H. said, "This has been the best graphing resource I have found. My students have really grasped line plots and scaled graphs much quicker because of this resource. I wish I had found it sooner! It would have saved some time on remediation. I'll definitely be using this much earlier in the year next year."
Copyright by Deb Hanson
Please note: The PowerPoint cannot be edited due to the copyright requirements made by the contributing artists (clip art, font, background).
This item is a paid digital download from my TpT store
www.teacherspayteachers.com/Store/Deb-Hanson
The resources in this bundle are to be used by the original downloader only. Copying for more than one teacher is prohibited. This item is also bound by copyright laws. Redistributing, editing, selling, or posting these items (or any part thereof) on an Internet site that is not password protected are all strictly prohibited without first gaining permission from the author. Violations are subject to the penalties of the Digital Millennium Copyright Act. Please contact me if you wish to be granted special permissions!


