Graphing Bundle - Task Cards & No Prep Worksheets - Bar Graphs & Picture Graphs
- Zip
- Easel Activity
Products in this Bundle (5)
Description
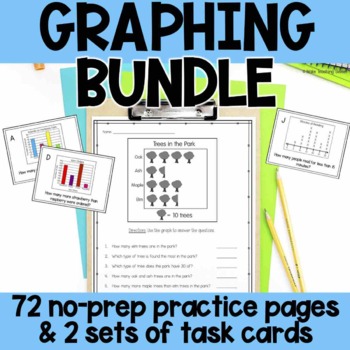
Ready to review bar graphs & picture graphs in your graphing unit? This file includes 24 graphing task cards & 72 no-prep worksheets. Practice reading, analyzing, & creating bar graphs and pictographs. Use as independent practice, as a math center, a formative assessment, homework, earlier finisher activity or however you choose!
BUNDLE & SAVE BIG! These 5 resources will supplement your graphing unit.
Teaching students to analyze data on graphs can be such a fun unit - but using the same graphs gets boring! Each task card features a different graph so your students will have a fun, hands-on way to practice reading graphs and answering questions. Task cards include bar graphs (vertical & horizontal), picture graphs, & line plots. Each task card has a graph and one question.
Choose the worksheet that your students need - the variety in these sets makes it easy to differentiate! Set 1 of all resources includes small numbers & scales of 1, 2, 5, & 10. Set 2 includes larger numbers and scales of 4, 5, 10, 20, 25, 50, 100, & 200. You can meet your learners where they are while challenging those that are ready. These scales are a great review of skip counting!
This file includes:
- 22 different vertical bar graph worksheets with 6-7 questions each
- 14 different picture graph worksheets with 6-7 questions each
- Answer Keys for all graphs
- 22 different blank vertical bar graph worksheets
- 14 different blank picture graph worksheets
- Answer Keys for all graphs
- 24 task cards
- Recording sheet
- Answer keys
Use these worksheets as independent practice after a lesson, as homework during a graphing unit, as a formative assessment, or however you choose! Copy & have ready for early finishers during your math block. These worksheets are ready to use - just print, copy, & go! All worksheets are in printer-friendly black & white and include an answer key.
You'll love how easy to use these worksheets are and how quickly you'll be able to see what your students have mastered.
Teachers have said:
⭐️⭐️⭐️⭐️⭐️ "This bundle has so much that I haven't used all of it. The kids did very well with what I did use and I have plans for using more of it this year."
⭐️⭐️⭐️⭐️⭐️ "This was perfect for what I needed for my third graders!"
Looking to go digital? 1 set of task cards is also available as an Easel digital activity - included with purchase of this file!
This bundle includes:
Create a Graph Worksheets: Set 1
Create a Graph Worksheets: Set 2
©Make Teaching Sweet
Permission to copy for a single classroom only.


