64 results
3rd grade graphing printables for Easel
![Preview of 3rd Grade End of the Year Math Review [[NO PREP!]] Packet](https://ecdn.teacherspayteachers.com/thumbitem/3rd-Grade-End-of-the-Year-Math-Review-NO-PREP-Packet-2470853-1714741123/original-2470853-1.jpg)
3rd Grade End of the Year Math Review [[NO PREP!]] Packet
End of the year 3rd Grade Math Packet - Great for finishing 3rd grade math concepts, summer review or beginning of the year 4th grade concepts as a review.A perfect resource for ending the school year, home schooling or your summer school needs!UPDATED TO INCLUDE DIGITAL for your distance learning needsMath review packet includes 22 pages of math practice directly aligned to third grade common core standards. Includes the following:Multiplication/Division3-digit addition addition/subtractionTime
Subjects:
Grades:
3rd
Types:
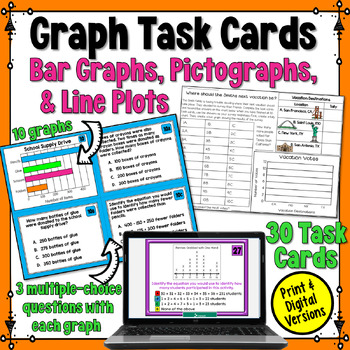
Graphing Task Cards: Scaled Picture & Bar Graphs, Line Plots 3rd Grade Practice
Graphing Task Cards: This set of 30 task cards is designed to give your third-grade students the opportunity to practice solving a variety of graph and data questions written in a multiple-choice format. Students will have many opportunities to interpret various types of graphs. It includes scaled bar graphs in both vertical and horizontal orientations. Scaled picture graphs and line plots are also included. For each graph provided, three questions follow.Students will interact with the data on:
Subjects:
Grades:
3rd - 4th
Types:
Also included in: Graphs Bundle: Scaled Bar Graphs, Pictographs, and Line Plots
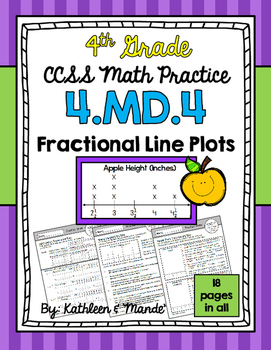
4.MD.4 Practice Sheets: Fractional Line Plots
This 4.MD.4 CCSS aligned packet includes 18 practice sheets to teach/reinforce line plots with whole numbers, fractions, and mixed numbers. These sheets can be used to introduce a concept, review a concept, or send home as reinforcement for homework. **An answer key is provided.- - - - - - - - - - - - - - - - - - - - - - - - - - - - - - - - - - - - - - - - - - - - - - - - - - - - - - - - - - - - - - - - - - -This resource can be used along with our other 4.MD.4 resources:4.MD.4 Task Cards: Set 1
Subjects:
Grades:
3rd - 5th
Types:
Also included in: 4.MD.4 BUNDLE: Fractional Line Plots
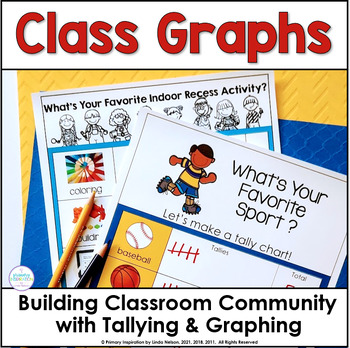
Bar Graphs & Tally Marks - Graphing Math Data to Build Classroom Community
This fun set of graphing activities gives your students lots of relevant practice collecting and interpreting data with ready-to-use bar graphs and tally mark charts. Plus, it builds classroom community and develops meaningful connections! Here's what this graphing and tallying resource includes!➯ 23 one page horizontal and vertical bar graphs designed to build classroom community as your students learn about how they are alike and different. Topics range from favorite foods, sports, and books,
Subjects:
Grades:
K - 3rd
Types:
CCSS:
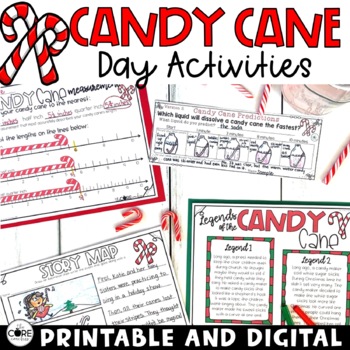
Candy Cane Day Activities - Candy Cane Science - December Themed Lesson Plans
Candy Cane themed activities to engage your students in meaningful learning mixed with fun! These Candy Cane activities are offered in both print and digital so teachers can mix it up to find the perfect balance of versatility that meets the face-to-face and device-based learning needs of a modern classroom.This resource is preloaded to Google Slides and SeeSaw. One click links are provided for the activities on both platforms making it easy to assign to students digitally. Please view the vid
Grades:
1st - 3rd
Types:
Also included in: 12 Days of Christmas Countdown - Christmas Activities Print and Digital
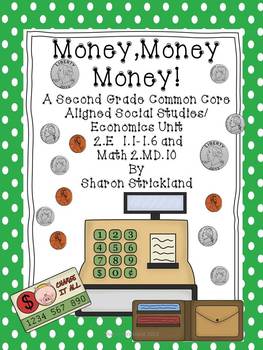
Second Grade Social Studies-Common Core Economics Unit
This is an economics unit for second grade that is aligned with Second Grade Common Core Social Studies Standard E.1.1-1.6. This unit includes almost everything you need to teach this standard. There are lesson plans for you, a student book, a study guide, a test, a take home project with a parent letter, a wallet and money and a classroom game. This is a 10 day unit.
Subjects:
Grades:
2nd - 3rd
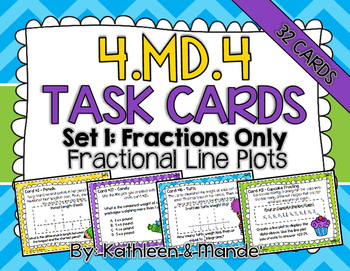
4.MD.4 Task Cards: Fractional Line Plots {Set 1: Fractions Only}
Looking for a fun, engaging way for your students to practice creating and interpreting fractional line plots? Your students will love practicing with these adorable, easy to use task cards. These 32 task cards are aligned to CCSS 4.MD.4: Fractional Line Plots.Do you want to assess the quality of our task cards before you buy? Try our {FREEBIE} 4.NF.7 Task Cards: Compare & Order Decimals. - - - - - - - - - - - - - - - - - - - - - - - - - - - - - - - - - - - - - - - - - - - - - - - - - - - -
Subjects:
Grades:
3rd - 5th
Types:
Also included in: 4.MD.4 BUNDLE: Fractional Line Plots
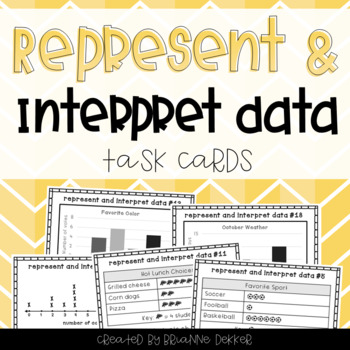
Represent and Interpret Data Task Cards
These 24 task cards target representing and interpreting data, aligned with the Grade 3 GoMath curriculum, Chapter 2. They include practice with reading and creating picture graphs and bar graphs as well as solving problems based on data, graphs, and line plots.
A recording sheet and answer key are included.
***
You might also be interested in:
- Represent and Interpret Data worksheets - $1
- Graphing the Weather Worksheets and Projects - $2
Would you like credit for future purchases?
Don'
Subjects:
Grades:
2nd - 4th
Types:
CCSS:
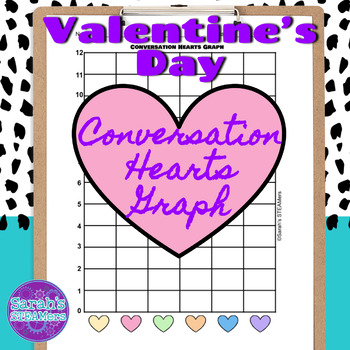
Valentine's Day Conversation Hearts Graphing Activity
What better way to incorporate math into your Valentine's Day than with a fun graphing snacktivity? This PDF contains a cover sheet, two graphs (one in color, one in B&W), and a question sheet. You can copy a graph and the question sheet back-to-back to save paper!You might also like:Sammy Cat: A Digital Escape RoomWriting Prompts Bundle2nd Grade Task Card BundleOpen The Box: Faith RinggoldPlants Mini Unit
Subjects:
Grades:
1st - 3rd
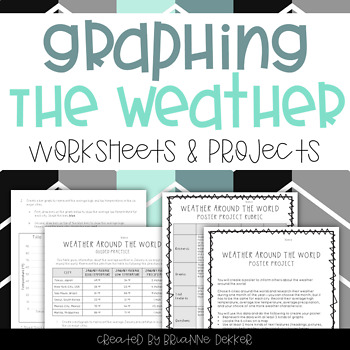
Graphing the Weather - Worksheets and Projects
This product contains science and math graphing worksheets and projects for a unit on weather. These resources were created with NGSS content and evidence statements in mind.
The first set of worksheets focus on weather around the world, and the second set focus on weather patterns in one area. Each set contains guided practice, in which students are given data and asked to create different types of graphs to represent the data; independent practice, in which students must gather data and then
Subjects:
Grades:
3rd - 5th
Types:
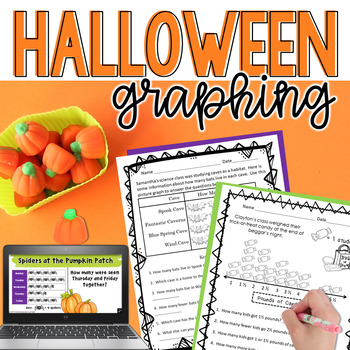
Halloween Graphing- Digital AND Printable Math Activities
Students will love creating and interpreting their own bar graphs, pictographs (picture graphs), and line plots with fractions on a number line! Printable worksheets, Digital Google Slides, and TpT Easel versions are all included in this fun Halloween Math Activity!Quickly print the Halloween math worksheets for centers, homework, morning work, bell ringers, or emergency sub plans. Or easily assign in Google Classroom or TpT Easel! Perfect for the whole month of October!Topics include Halloween
Subjects:
Grades:
3rd - 5th
Types:
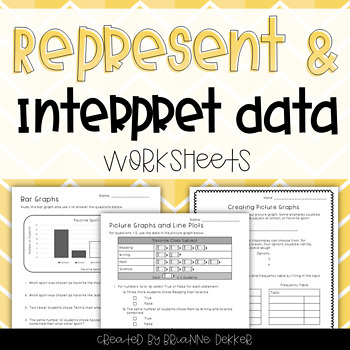
Represent and Interpret Data Worksheets
I created these four worksheets to go along with my Grade 3 GoMath curriculum, Chapter 2. This product includes a worksheet each on bar graphs, picture graphs, and line plots, and a project for creating picture graphs. Students will practice using and making tally tables, frequency tables, graphs, and line plots, as well as answer questions based on the data.
Answer keys are included for all worksheets.
*This product is included in my Math Worksheets Bundle. Click here for more information!*
Subjects:
Grades:
2nd - 4th
Types:
Also included in: Math Worksheets Bundle
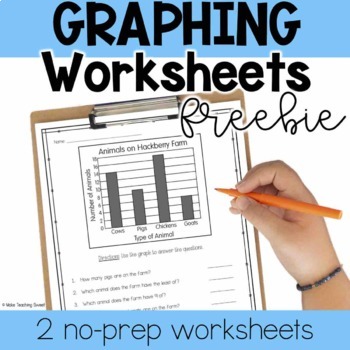
Graphing Worksheets - Interpreting Bar Graphs and Picture Graphs - Freebie!
Ready to review bar graphs & picture graphs in your graphing unit? These 2 no-prep black & white worksheets are perfect to see what students can do! Practice reading & analyzing bar graphs and picture graphs. Use as independent practice, as a math center, a formative assessment, or however you choose!Choose the worksheet that your students need - this freebie makes it easy to differentiate! This file includes a graph with a scale of 2 for early learners, as well as a graph with a sc
Grades:
1st - 4th
Types:
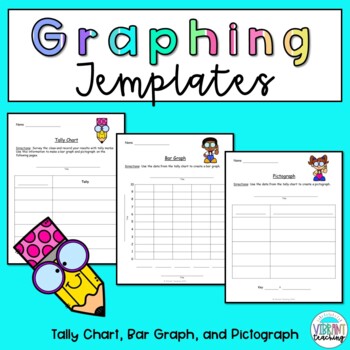
Graphing Templates: Tally Chart, Bar Graph, and Pictograph
Use these graphing templates to create a tally chart, bar graph, and pictograph. Students will be so excited to choose a topic, complete a survey, and record their data on these graphs. Each activity comes in color and black and white. The color copy is great to project on the board to do a class example first.Digital Learning:Includes a digital version using the TPT Digital Activity Tool. Text boxes have already been inserted so students can easily type their responses. You can also edit the
Grades:
1st - 3rd
Types:
Also included in: Graphing Worksheets: Tally Chart, Bar Graph, and Pictograph
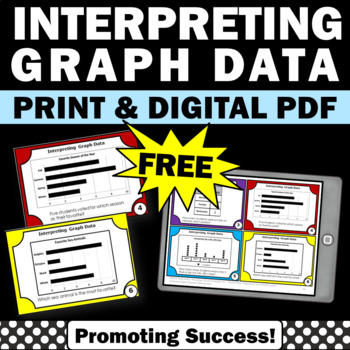
FREE Interpreting Bar Graphs and Data Task Cards 2nd 3rd Grade Math Center Games
DIGITAL PDF AND PRINTABLES: You will download six free task cards for your second grade and third grade students to practice interpreting graphs. You may use the printable task cards in math centers or stations for fun review games and activities, such as a scavenger hunt or SCOOT. They also work well for transition activities, as exit tickets and for morning work, quick formative assessments. Game ideas, a student response form and answer key are included.✔︎ Common Core Math Standards Lesson P
Subjects:
Grades:
2nd - 4th
Types:
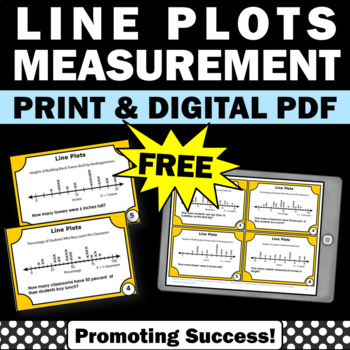
FREE Line Plots Measurement Task Cards 2nd Grade Math Review Centers Games
DIGITAL PDF AND PRINTABLES: You will download six FREE task cards for 2nd or 3rd grade students to practice line plots. You may use the printable task cards in math centers or stations for fun review games and activities, such as a scavenger hunt or SCOOT. They also work well for transition activities, as exit tickets and for morning work, quick formative assessments. Game ideas, a student response form and answer key are included.➔➔ Click HERE for 30 more line plots task cards.➔➔ Click HERE for
Subjects:
Grades:
2nd - 3rd
Types:
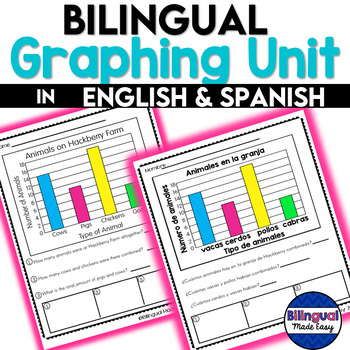
Graphing Worksheets in English & Spanish DIGITAL LEARNING
This Bilingual (English & Spanish) Graphing Unit for second and third grade students includes 10 different types of graphing worksheets.Each worksheet is available in black and white or in color for teachers to model. Each graph worksheet was created in English and has an identical worksheet in Spanish. This unit was designed to be used with English Language Learners in a Bilingual, English as a Second Language or Dual Language classroom. You no longer need to translate your worksheets or br
Subjects:
Grades:
2nd - 3rd
Types:
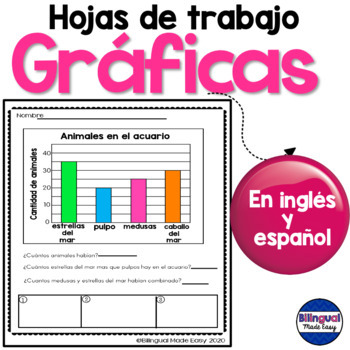
Hojas de trabajo de matemáticas: Graficas en inglés y español
USE AS A DIGITAL PRODUCT OR PRINT THE PDFThis Bilingual Graphing Unit (English/Spanish) for second and third graders includes 10 different types of graphing worksheets to master this mathematical skill. Graphs are also included in color for a teacher to model. Each graph worksheet was created in English and has an identical worksheet in Spanish. This unit was designed to be used with English Language Learners in a Bilingual, English as a Second Language or Dual Language c
Subjects:
Grades:
2nd - 3rd
Types:

Christmas Holiday Craftivity - Create a Holiday Cup Opinion Writing
Students will design and create a holiday-themed Starbucks cup. They will then write an opinion piece about why their design is the best! Students, another class, or an administrator can vote and be the judge to decide on a winner or you can let everyone be a winner! A full preview is available to help you decide if this activity will be a good fit for your classroom.Standards Addressed: CCSS ELA: Literacy 2.1, 3.1, 4.1What You Get★ Directions for set up★ Information about the Starbucks Holiday
Grades:
2nd - 5th
Types:
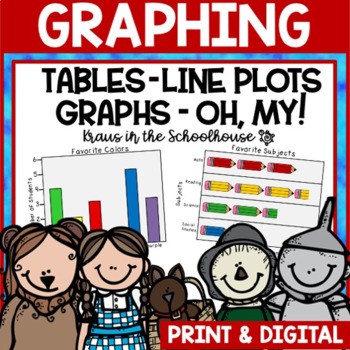
Graphing Activities and Worksheets | Easel Activity Distance Learning
Printable and TpT digital activities included for kids to practice their graphing skills. Students will learn about tally tables, frequency tables, picture graphs (pictographs), horizontal bar graphs, vertical bar graphs, line plots, circle graphs, and line graphs.This resource has a Easel Activity for distance learning already created for students to input their responses in answer boxes and to use other tools to draw and highlight. It is an Interactive layer over the original pdf. Click here
Grades:
2nd - 4th
Types:
Also included in: Math Activities Bundle
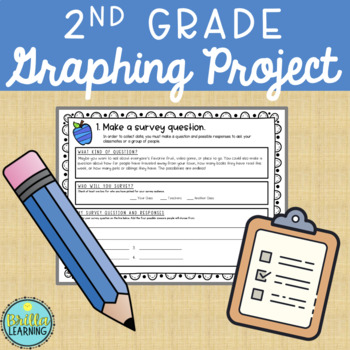
2nd Grade Graphing Project
Engage students with this fun, personalized math project! Students will get to show their knowledge of data and graphs by conducting a survey, gathering the responses, showing it in a graph, and creating some word problems about their graph. They can present it to the class to practice speaking skills as well. For early finishers, a "Challenge Page" is included where they must show their data in a different kind of graph. A 4-1 scale rubric is provided to use this project as a formal assessment
Subjects:
Grades:
1st - 3rd
Types:
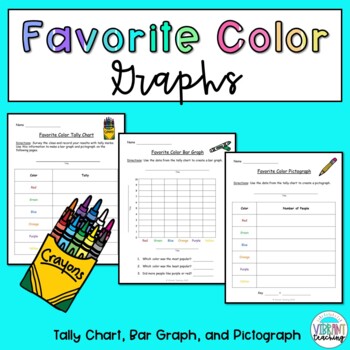
Favorite Color Graphs: Tally Chart, Bar Graph, and Pictograph
What's your favorite color? Students can use these favorite color graphing worksheets to complete a survey and collect data. Then they will create a tally chart, bar graph, and pictograph. Each activity comes in color and black and white. The color copy is great to project on the board in class or to use as a digital activity.Digital Learning:Includes a digital version using the TPT Digital Activity Tool. Text boxes have already been inserted so students can easily type their responses. You can
Grades:
1st - 3rd
Types:
CCSS:
Also included in: Graphing Worksheets: Tally Chart, Bar Graph, and Pictograph
Line Plot Freebie
In this freebie you will find one line plot sample, one blank line plot, and measurement line plots. This product was specifically designed for grade 3 however can be used for other grades. Please do not rate this product low or leave unkind feedback as it is free.Domain: Measurement and Data (MD)Cluster: Represent and interpret data.Standard: 3.MD.4. Generate measurement data by measuring lengths using rulers marked with halves and fourths of an inch. Show the data by making a line plot, where
Subjects:
Grades:
3rd
Types:
2 Tally Marks Tables & Bar Graphs - Favorite foods & desserts
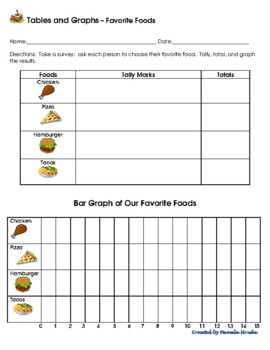
2 Tally Marks Tables & Bar Graphs – Favorite Foods & Favorite DessertsVocabulary: survey, data, tally marks, bar graph. Directions: Activate prior knowledge about vocabulary words; display student answers. Discuss what it means to take a survey. How can we display our data? Explore different types of graphs (bar, line, picture, pie, histogram). Discuss/model tally marks. How do we use them? How does skip-counting help us here? Students take a survey of their classmates’ favorite food (or
Subjects:
Grades:
K - 3rd
Types:
Also included in: 7 Tally Marks Tables & Longitudinal Bar Graphs BUNDLE
Showing 1-24 of 64 results


