60 results
3rd grade statistics projects for staff
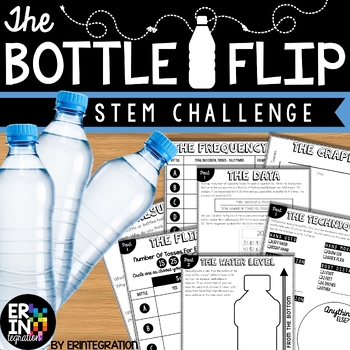
Water Bottle Flip STEM Challenge + STEM Activity
The ORIGINAL water bottle flip STEM activity and lab! Water bottle flip at school? Absolutely! Students will love this on-trend STEM challenge inspired by the popular YouTube water bottle flipping challenge where students toss a water bottle and attempt to land it straight up. Practice scientific method with some probability, fractions and data collection in the mix while having fun!This self-paced, low-prep, project based learning water bottle flip STEM challenge is print-and-go. Each activit
Subjects:
Grades:
3rd - 6th
Types:
CCSS:
NGSS:
K-2-ETS1-2
, K-2-ETS1-3
, MS-ETS1-2
, K-2-ETS1-1
, 3-5-ETS1-3
...
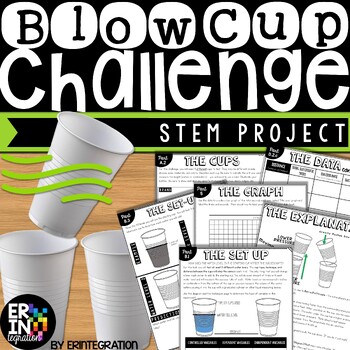
Blow Cup STEM Challenge and Scientific Method Project
The Blow Cup Challenge is now a STEM activity with this engaging science project inspired by the viral video where students try to blow one cup into another cup. Great low-prep way to teach the scientific method, variables and review math skills!This self-paced, multi-part Blow Cup STEM challenge is print-and-go. Each activity sheet guides students through the project. STEM Challenge Overview:Students will use the included visual directions, graphic organizers, charts, and activities to...Deter
Subjects:
Grades:
3rd - 6th
Types:
NGSS:
MS-PS2-2
Create Your Own Survey: Collect, Organize, Graph, and Analyze Data
One of my best-selling TPT products -- now updated with a fresh look and new content!Teach Data Analysis the open-ended and engaging way -- through student-directed surveys!This resource pack is designed to help students follow the process of creating a survey: they will brainstorm questions, collect data, organize their obtained data, create multiple graphs to show their data, and then reflect on and analyze what their data tells them.The survey pack includes the following:Brainstorming Survey
Subjects:
Grades:
2nd - 5th
Types:
Probability Carnival
**FULL Preview Available!**
Time for a carnival! In this probability project, students are asked to create a game of chance for a class carnival. Students will need to write directions for their game. They will also need to decide if the game is fair or unfair and explain why. Finally, the students are asked to list several possible outcomes of the game and give the probability of each outcome as a fraction and using the words likely, unlikely, certain or impossible.
This product includes:
A
Subjects:
Grades:
3rd - 6th
Types:
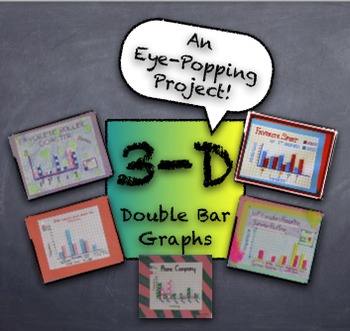
3-D Double Bar Graphs PROJECT from Student Generated Survey Data - Fun Project
This project creates quite an impressive product with simple supplies easily accessible in any classroom. Students generate data from surveys given to peers, using simple questions like, "What's your favorite pizza topping?" Students use survey results to create a 3-dimensional "girls versus boys" double-bar graph. Using centimeter graph paper, markers, and glue sticks, the double-bar graph projects are truly eye-popping! Project description, survey information, and graph assembly instructio
Subjects:
Grades:
3rd - 12th, Adult Education
Types:
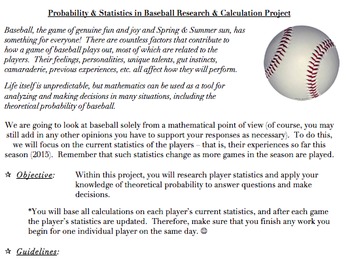
Probability & Statistics in Baseball Project (Common Core Aligned, AND FUN!)
The problems and activities within this document are designed to assist students in achieving the following standards: 6.SP.B.5, 7.SP.C, HSS.CP.A.2, HSS.CP.A.3, HSS.CP.B.7, HSS.CP.B.9, as well as the standards for mathematics practice and the literacy standards. They are also designed to help the teacher assess the students’ abilities when it comes to working with the ideas within the standards.This document contains the following:A project designed to allow students to investigate theoretical
Subjects:
Grades:
5th - 12th, Higher Education, Adult Education, Staff
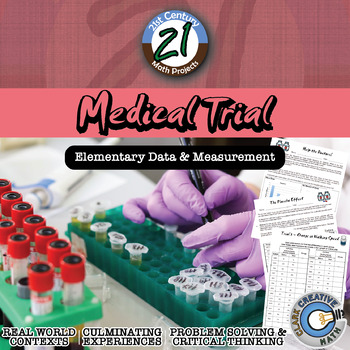
Medical Trial -- Elementary Data Edition - Medical - 21st Century Math Project
Bring your students into the world of double blind medical studies. Every day, doctors and hospitals rely on scientific studies and research to make healthcare decisions for patients. Are some medicines more effective than others? Do certain types of patients benefit more from certain types of treatments? Due to the security of medical records, studies are somewhat limited in their scope and are generally carried out at universities and research hospitals. At these facilities ground breaking wo
Subjects:
Grades:
3rd - 5th
Types:
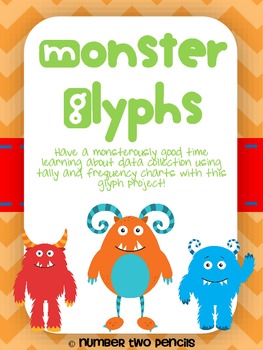
Monster Glyph and Graph
In this monster glyph activity students create a unique glyph while teaching classmates about themselves. Students then use the class glyph to collect and analyze data, creating their own graphs as displays. This project is especially great because its complexity can be easily differentiated across grades and customized for the individual needs of your students.
This work is licensed under a Creative Commons Attribution-NonCommercial-NoDerivs 3.0 Unported License.
Subjects:
Grades:
1st - 4th
Types:
Graphing and Data Analysis Survey Project for Grades 3 to 5 - fillable PDF!
I created this resource to be used as a final project activity for a data analysis/graphing unit. Before doing this activity, students should already know a lot about the topic and/or have access to resources such as textbooks to clarify vocabulary such as key, scale, bar graph, survey, pictograph, etc. It usually takes my students about 3 – 4 class ‘periods’ to complete the project from beginning to end.The download is a zip folder with two files: One page of teacher instructions/tips, and on
Subjects:
Grades:
3rd - 5th
Types:
Collect, Organize, Graph, and Analyze Data Project
Includes the WHOLE process:
Generate a survey question to collect data
Record survey results in an organized tally chart
Graph data on a bar graph
Analyze data (observations & inferences) in a written paragraph
Many uses:
Homework
Formative Assessment
Summative Assessment
Review
Differentiated Assignment
Includes:
Student-friendly Directions
Data Recording Sheet
Rubric
Subjects:
Grades:
3rd - 6th
Types:
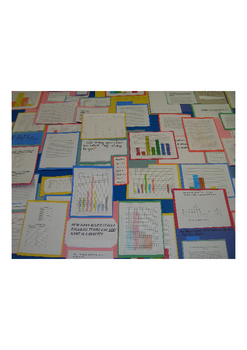
Graphing Project - Student Survey, Statistics, Descriptive Paragraph, Display
This project is an excellent way to end a unit on graphing and statistics. You will need to have covered the calculation of range including minimum and maximum values, mean, median, and mode. In addition, students will need to know how to make a line plot (the number line with Xs over each corresponding value), a frequency table, and several types of graphs. Note that students love and are familiar with pie charts, but these can be difficult to master and they are a great extension for students
Subjects:
Grades:
3rd - 7th
Types:
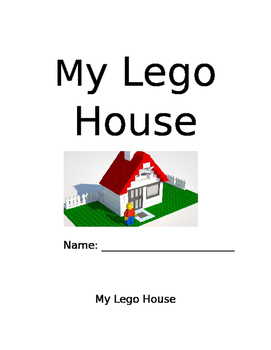
My Lego House
This is a 2-3 week maths project for anyone from Grade 3-6. Done in pairs or small groups the project entails students designing and building their own Lego house. In the project students will cover a range of maths concepts including area, perimeter, counting, money, graphing and interpreting data. The project includes a detailed teacher booklet with photographs of student's work and examples for each of the lessons. The student book is also included for students to work from, although we found
Subjects:
Grades:
3rd - 6th
Data Project - Data representation and interpretation
This booklet walks students through the stages of data investigations:
STAGE 1: Deciding on a topic and posing a question
STAGE 2: Collecting raw data
STAGE 3: Graph or Display
STAGE 4: Analyse and Interpret
STAGE 5: Draw conclusion, reflect
The booklet has clear explanations at appropriate stages to support students in the more technical maths such as finding averages.
IF YOU LIKE THIS RESOURCE - PLEASE RATE
Subjects:
Grades:
3rd - 8th
Types:
Data Landmarks- Watermelon Seed Spitting Contest
Teach your students about data landmarks in a fun way by having a watermelon seed spitting competition. Students will learn about mean/average, mode, minimum, maximum, range and outliers while having fun!
Gather the students, round up some volunteers, and pick a nice day to head outside.
Students will keep track of the distance for each of their seed spits. After the outdoor activities you will head back in to compile the data, organized the data so it is easier to interpret, find data landma
Subjects:
Grades:
3rd - 5th
Types:
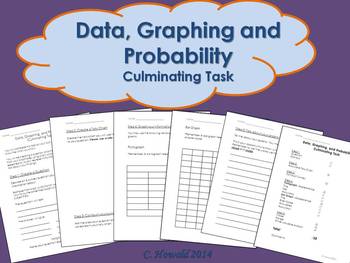
Graphing Unit Culminating Project
I used this activity as a summative assessment for my Data, Graphing and Probability Unit. This gave students the opportunity to create their own question, survey a group of students (visited another class in the school), collect, display and analyze their data.
I have left this as a .doc file so that you are able to adjust it to fit the needs of your classroom.
If you have any questions or concerns, let me know!
Thanks for downloading. Please take the time to rate this product.
If you e
Subjects:
Grades:
2nd - 4th
Types:
Superbowl Statistics, Graphing Project with Writing Prompt 3-5
****NEWLY UPDATED*****
This project has students selecting a team that will win the Superbowl, then using statistics from the season and graphing to PROVE their team will win. The document lists requirements, types of graphs and ideas for ways to show data with the team's season statistics. Teachers/students will need to go to the NFL website and research the statistics. Teachers could also print these off for teams to use.
The second half of the project has been added in support of CCSS. Stude
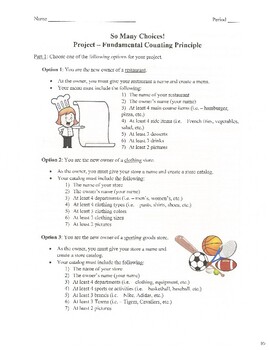
Fundamental Counting Principle Project (So Many Choices!)
In this project, students are given three scenarios to choose from. They can own a new restaurant, clothing store, or sporting goods store. For each situation, they are given a list of categories that can be used to create customer choices. They will then relate their menu (or catalog) to probability and, more specifically, the fundamental counting principle. A rubric is provided to guide instructor grading. This is an open-ended project, so it is accessible to both beginning learners and a
Subjects:
Grades:
3rd - 12th
Types:

Probability with Skittles: Leveled Hands On Learning Activity Project
This Probability with Skittles project allows students to learn hands on with real candy. Using candy will increase student engagement. The assignment is also leveled into 3 levels. The first level practices simple, basic probability. The second level is simple probability but requires more thought. The last level 3 practices independent and dependent probability. The activity can be edited to the level of difficulty being assessed and for differentiated to individual students or small groups. T
Subjects:
Grades:
3rd - 9th
Types:
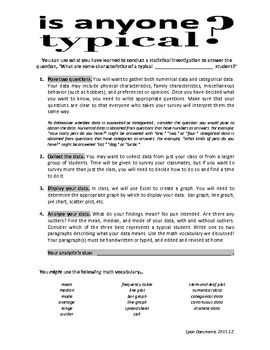
Statistics Analysis Project - Is Anyone Typical?
A great way for students to apply and use basic statistics: mean, median, mode, range, outlier, categorical and numerical data, and graph types. Incorporates Excel. Fun, engaging, and easy to teach. Also, a great way for "tweens" to learn that no one is "typical." Appropriate for third through eighth grade. I use it with my fifth and sixth graders and it is always a huge hit! The results also look great on our bulletin board!
Subjects:
Grades:
3rd - 8th
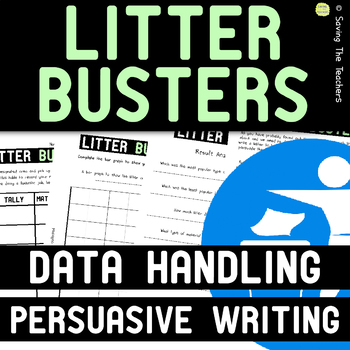
Litter Busters: Project Based Learning - Statistics - Persuasive Writing
Plastic waste is becoming a huge issue around the globe. This activity is a fun way to highlight the problem while spending time outside and learning about data handling / statistics. For this activity, your class will take part in a litter pick, collecting their results in a tally before transferring them onto a bar graph. They will then answer some questions about what they have found out. This activity works best away from the school grounds (beach, park, etc.) - you may need to create a risk
Subjects:
Grades:
3rd - 4th
Also included in: Outdoor Math Activities Growing Bundle
Les arbres SCIENCE PROJECT
Vous voulez planter des arbres avec vos élèves dans le cadre du cours de sciences, mais vous ne savez pas trop par où commencer? Ce document vous aidera assurément à mener à terme ce projet. Ce document de 29 pages contient :- 2 affiches en couleur- 1 cahier de l’élève + corrigé- 1 évaluation + corrigé- 1 mot caché Voici le matériel à vous procurer :- Glands de chêne- Terre ou terreau - Pots (ou tout autre récipient jetable trouvé dans votre panier de récupération) Ce document s’adresse aux élèv
Subjects:
Grades:
3rd - 4th
Types:
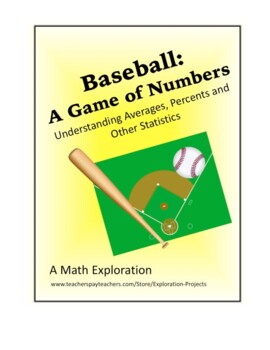
Math- Baseball: A Game of Numbers
In this Exploration, students will examine the statistics of four baseball players. The focus is to understand how the data is calculated. This classic American sport has always used math to keep track of everything that happens in the game. This math Exploration includes detailed, student-friendly Steps to Success that lead the learner through the process of creating a high-level, quality independent project. To add rigor and thoughtfulness, students reflect on their Exploration by answering s
Subjects:
Grades:
3rd - 8th
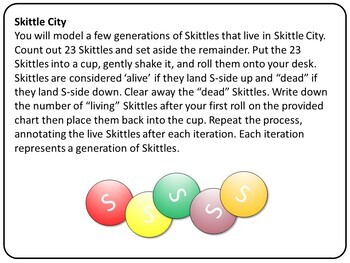
Skittle City: A Fun Mathematical Modeling game for recursion and probability
This exercise is incredibly fun! It is designed to challenge students to explore data analysis and discover about the math concepts of recursion and probability. Students break up in groups and work on modeling a notional Skittle City population. I firmly believe that experience should come before learning formal math formulas and definitions. This is a great way to get the students engaged and have them learn these concepts without even realizing it!Full instructor guide and Answer Key included
Subjects:
Grades:
3rd - 12th
Types:
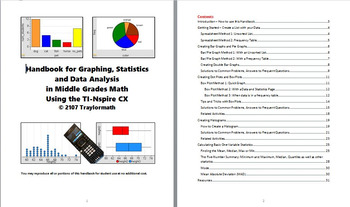
Graphing, Statistics & Data Analysis in Middle Grades Using TI-Nspire
This 30-page handbook ties together everything you need to use TI-Spire technology to teach middle school level data graphing and statistics. It will show you, step-by-step, how to create bar graphs, pie graphs, dot plot, box plots and histograms, and several methods for finding mean and quartiles, as well as an easy way to calculate Mean Absolute Deviation (MAD) with TI-Nspire. It also answers all those student questions about "why doesn't my graph look right?" Developed though several years of
Subjects:
Grades:
5th - 9th, Staff
Showing 1-24 of 60 results


