TPT
Total:
$0.00

Create Your Own Survey: Collect, Organize, Graph, and Analyze Data

Rated 4.74 out of 5, based on 34 reviews
4.7 (34 ratings)
;
Playful STEM
416 Followers
Grade Levels
2nd - 5th
Resource Type
Standards
Formats Included
  • PDF
Pages
25 pages
$4.00
$4.00
Share this resource
Report this resource to TPT
Playful STEM
416 Followers

What educators are saying

I needed something a little more challenging for the kids to use for graphing. This resource is good, students worked in small groups to create their own graph.
My students are using this for an end of unit project. It has been great. They were able to download the pages I sent and edit them on Notability, this saves on paper, but also allows them to be creative with their graphs.

Description

One of my best-selling TPT products -- now updated with a fresh look and new content!

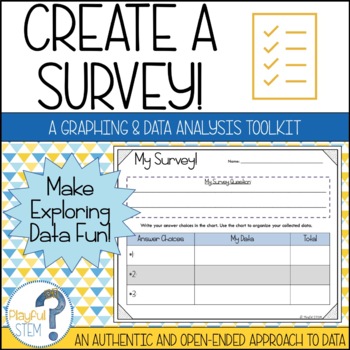
Teach Data Analysis the open-ended and engaging way -- through student-directed surveys!

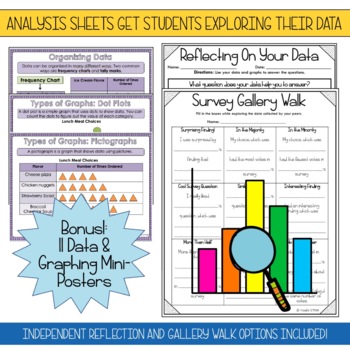
This resource pack is designed to help students follow the process of creating a survey: they will brainstorm questions, collect data, organize their obtained data, create multiple graphs to show their data, and then reflect on and analyze what their data tells them.

The survey pack includes the following:

  • Brainstorming Survey Questions
  • Collecting Data
  • My Survey (Data Organization)
  • My Pictograph
  • My Dot Plot
  • My Bar Graph
  • My Scatter Plot
  • Reflecting on Your Data
  • Survey Gallery Walk

Plus, 11 mini-posters focusing on the concepts covered in the survey project!

By using this pack, students should become adept at carrying out the process of conducting a survey, comparing and contrasting different types of graphs, and articulating what information they can learn from their survey data.

Let’s Keep in Touch!

Thanks for stopping by my store. Check out the links below to stay connected to all things Playful STEM!

Playful STEM
TPT Store - Click the green star to follow and be updated about new products.
Instagram

Total Pages
25 pages
Answer Key
N/A
Teaching Duration
N/A
Report this resource to TPT
Reported resources will be reviewed by our team. Report this resource to let us know if this resource violates TPT’s content guidelines.

Standards

to see state-specific standards (only available in the US).
Draw a picture graph and a bar graph (with single-unit scale) to represent a data set with up to four categories. Solve simple put-together, take-apart, and compare problems using information presented in a bar graph.
Draw a scaled picture graph and a scaled bar graph to represent a data set with several categories. Solve one- and two-step “how many more” and “how many less” problems using information presented in scaled bar graphs. For example, draw a bar graph in which each square in the bar graph might represent 5 pets.

Reviews

Questions & Answers

416 Followers