24 results
3rd grade statistics research for staff
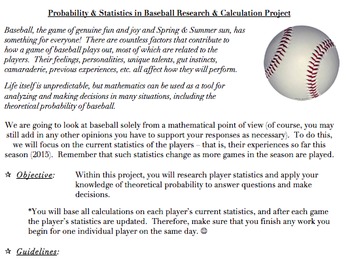
Probability & Statistics in Baseball Project (Common Core Aligned, AND FUN!)
The problems and activities within this document are designed to assist students in achieving the following standards: 6.SP.B.5, 7.SP.C, HSS.CP.A.2, HSS.CP.A.3, HSS.CP.B.7, HSS.CP.B.9, as well as the standards for mathematics practice and the literacy standards. They are also designed to help the teacher assess the students’ abilities when it comes to working with the ideas within the standards.This document contains the following:A project designed to allow students to investigate theoretical
Subjects:
Grades:
5th - 12th, Higher Education, Adult Education, Staff
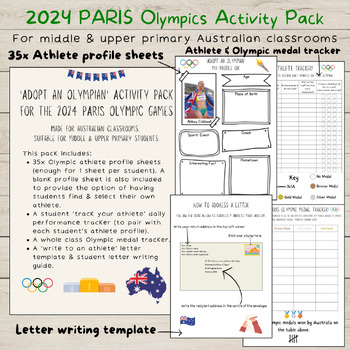
2024 PARIS Olympic Games Activity Pack | Middle & Upper Primary | Australia
Are you an Australian Teacher who is looking for a fun & engaging way to connect your students to the 2024 PARIS Olympic Games? This is the PERFECT resource for you! This activity pack provides students with the opportunity to:Research & profile an Australian Olympic athlete who has been selected to compete at the 2024 Paris Olympic Games.Individually track their athlete over the 19 days of the Olympic Games.Write a personal letter of support to their athlete, to be posted to them at the
Subjects:
Grades:
3rd - 6th
Types:
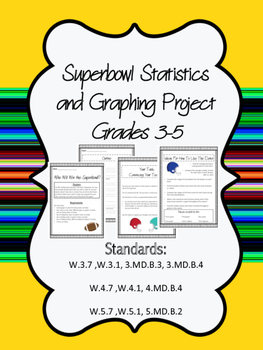
Superbowl Statistics, Graphing Project with Writing Prompt 3-5
****NEWLY UPDATED*****
This project has students selecting a team that will win the Superbowl, then using statistics from the season and graphing to PROVE their team will win. The document lists requirements, types of graphs and ideas for ways to show data with the team's season statistics. Teachers/students will need to go to the NFL website and research the statistics. Teachers could also print these off for teams to use.
The second half of the project has been added in support of CCSS. Stude
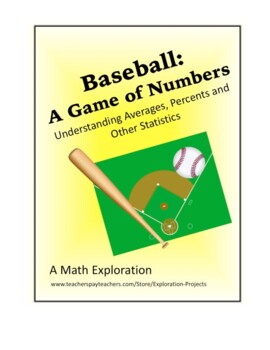
Math- Baseball: A Game of Numbers
In this Exploration, students will examine the statistics of four baseball players. The focus is to understand how the data is calculated. This classic American sport has always used math to keep track of everything that happens in the game. This math Exploration includes detailed, student-friendly Steps to Success that lead the learner through the process of creating a high-level, quality independent project. To add rigor and thoughtfulness, students reflect on their Exploration by answering s
Subjects:
Grades:
3rd - 8th
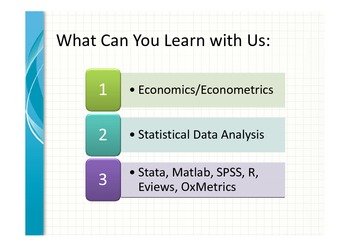
e-Learning AnEconomist Online Course Coupen
Please email this Coupen: TEACHPAYCOUP when you register for the courses in Econometrics, Stata, Matlab, SPSS, Eviews and R. You get 100GBP off the portal fee. Register on http://elearning.aneconomist.com and email on moodle@aneconomist.com ask for discounted invoice for your course. All courses are offered Online, Live and Personalized. Each lecture is recorded and recordings DVD will be provided after the course is completed.
Grades:
11th - 12th, Higher Education, Adult Education, Staff
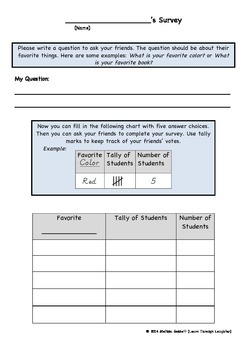
Student Created Survey and Bar Graph
INQUIRY BASED LEARNING! This activity gives students the chance to answer their own burning questions. Examples can include the following: What is the favorite video game of my friends? Do more people in this class like pizza or hamburgers? Which football team is the most popular in this class?
Students are walked through the steps of selecting a topic, gathering data, inserting it into a bar graph, and analyzing the results. It is interesting to see the topics they dream up! This activity can
Subjects:
Grades:
2nd - 3rd
Types:
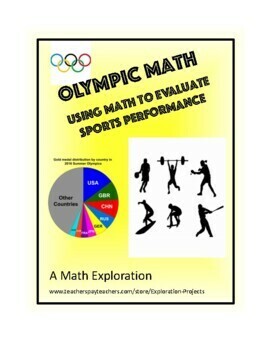
Math- Olympic Math:Using Math to Evaluate Sports Performances
Students will look at the Olympic games through a mathematical lens. Using their mathematical thinking they will use data and research to create graphs and story problems. If you are doing this Exploration during an Olympic year, students can use the data from this year. If there are no Olympics happening this year, choose a historic Olympics to analyze.This math Exploration includes detailed, student-friendly Steps to Success that lead the learner through the process of creating a high-level,
Subjects:
Grades:
3rd - 8th
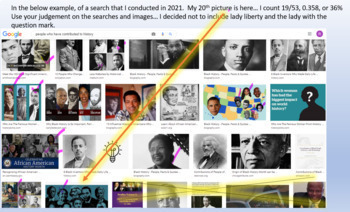
Women's History Month Probability Project
Students learn about suffrage and representatio of women. Students conduct Google searches on favorite subject, sport/hobby, future career and find the probability of a woman appearing in the first 20 images. Students make conjectures about representation of women in those areas. Students identify women they admire and create a video summarizing their findings.Can be adapted to images for African Americans for Black History Month, Hispanic Americans for Hispanic Heritage Month, etc.
Subjects:
Grades:
6th - 12th, Adult Education, Staff
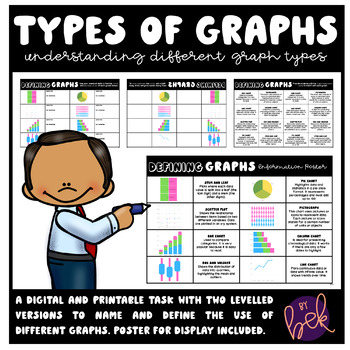
Types of Graphs | Identifying Names & Purpose | Printable & Digital
Types of Graphs Identifying Names & Purpose This task was designed as a "tuning in" to graphs task. Students have the opportunity to complete this task in two ways, either researching for themselves or using the provided definition cards to cut and paste. By completing this task students will have a resource to look back on when deciding which graph is best for their work/project. You'll get:1 research based template1 cut and paste templateA link to the GoogleSlides file for digital useHow t
Subjects:
Grades:
3rd - 6th
Types:
A Statistics Glossary with Symbols and Formulas
This is a very comprehensive statistics glossary from A to Z with a number of statistical symbols and formulas. It can be used as a resource book for any form of statistics in high school, undergraduate or graduate levels.
Subjects:
Grades:
9th - 12th, Higher Education, Adult Education, Staff
Circle Graph Project
This is a project for pairs or teams of students. They choose a question to graph by coming up with up to 6 possible responses. Then they ask their classmates and turn their answers into a circle graph.
Subjects:
Grades:
2nd - 6th
Types:
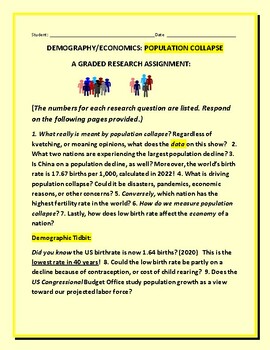
POPULATION COLLAPSE
This research assignment opens the eyes of students as to where we stand insofar as population collapse is concerned. Are we really aware of the consequences that are economic as well? This is a graded assignment. This assignment grade crosses over into demography (social studies), and economics. Thanks for visiting and supporting our humble shop. Excelsior! Statistics give birth to planning and development!
Subjects:
Grades:
9th - 12th, Higher Education, Adult Education, Staff
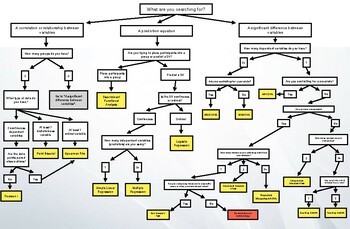
Statistical Analysis Flowchart
Need help figuring out which statistical test to use to answer your research question? This flowchart will help you decide by following a series of arrows regarding your question.
Subjects:
Grades:
9th - 12th, Higher Education, Adult Education, Staff

Ethics and Research: Special Problems and Ethical Issues in Research
Research in child and family investigates dispositional, experiential, and environmental factors that contribute to physical, mental, emotional, and social development in human beings during the early years of life course. As Eunice Kennedy Shriver’s National Institute of Child Health and Human Development puts it “The overall goals of Child and Family Research are to describe, analyze, and assess the capabilities and proclivities of developing human beings, including their genetic characteristi
Grades:
Higher Education, Adult Education, Staff
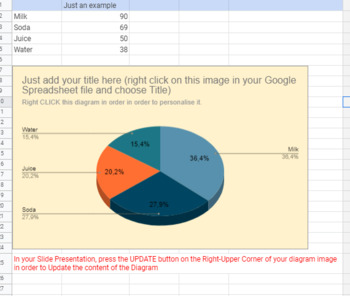
3D Editable Radial Diagram - Google Slide and Google Sheet files
With this 3D Editable Radial Diagram you can easily prepare your diagram presentations and you can use them in almost any activity. Be creative!Useful for any teacher that wants to explain and demonstrate what is a diagram, why and when people are using it. Radial Diagrams help you and your students visualize the results, learn fractions, etc.This is an editable Radial Diagram. You will get 1 Google Spreadsheet File and 1 Google Slide file. You will edit all the data in the Spreadsheet and you w
Subjects:
Grades:
1st - 12th, Higher Education, Adult Education, Staff
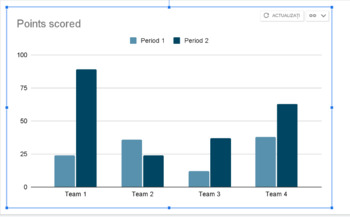
Editable Double Column Chart Diagram for Digital Learning - Google Slide
With this Editable Double Column Chart Diagram for Digital Learning you can easily prepare your column chart diagram presentations and you can use them in almost any activity. Be creative!Useful for any teacher that wants to explain and demonstrate what is a column chart diagram, why and when people are using it. Column chart Diagrams help you and your students visualize the results, read diagram charts, etc.This is an editable Column Chart Diagram. You will get 1 Google Spreadsheet File and 1 G
Subjects:
Grades:
1st - 12th, Higher Education, Adult Education, Staff
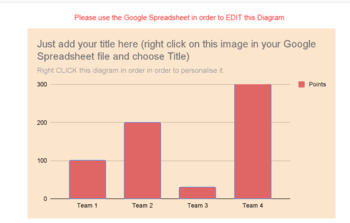
Editable Chart Diagram - One Column - for Digital Learning - Google Slide
With this Editable One Column Chart Diagram for Digital Learning you can easily prepare your column chart diagram presentations and you can use them in almost any activity. Be creative!Useful for any teacher that wants to explain and demonstrate what is a column chart diagram, why and when people are using it.Column chart Diagrams help you and your students visualize the results, read diagram charts, etc. Very helpful for math activities and statistics.This is an editable Column Chart Diagram. Y
Subjects:
Grades:
1st - 12th, Higher Education, Adult Education, Staff
Types:
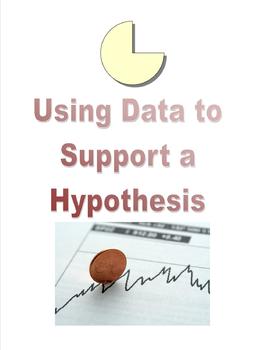
Using Data to Support a Hypothesis
In this math challenge, students must create a hypothesis and then collect and display data to support their hypothesis!
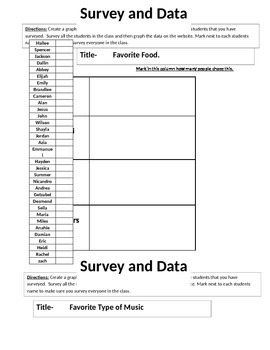
Collect Data for graphing worksheet
6 different worksheets for collecting data to create a graph. Includes a student check-off list to make sure that each student is surveyed. Fun engaging activity that will be a hit.
CLICK PREVIEW to see a detailed video about this lesson
If you like this lesson please follow us.
Subjects:
Grades:
3rd - 7th
Types:
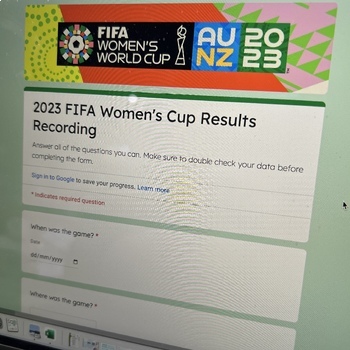
2023 FIFA Women's World Cup Data Recording Google Form
Let's celebrate the FIFA Women's World Cup and engage students in gathering data. This Google Form gathers:- Game results- Attendance at the game/Ticket sales- Goals- Attempted goals- Cards- Why cards were givenUse this data to further Statistical Investigation skills and support rich real-world Maths learning. This is designed to work with the 2023 FIFA Women's World Cup Data Recording Google Form, 2023 FIFA Women's World Cup Data Recording Template and 2023 FIFA Women's World Cup Goal Line Gra
Subjects:
Grades:
2nd - 12th
Types:
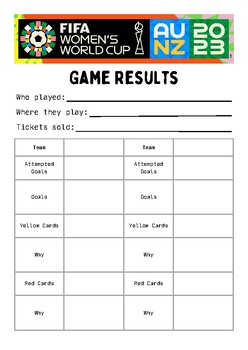
2023 FIFA Women's World Cup Data Recording Template
Let's celebrate the FIFA Women's World Cup and engage students in gathering data. This template gathers:- Game results- Attendance at the game/Ticket sales- Goals- Attempted goals- Cards- Why cards were givenUse this data to further Statistical Investigation skills and support rich real-world Maths learning. This is designed to work with the 2023 FIFA Women's World Cup Data Recording Google Form, 2023 FIFA Women's World Cup Data Recording Template and 2023 FIFA Women's World Cup Goal Line Graph
Subjects:
Grades:
2nd - 12th
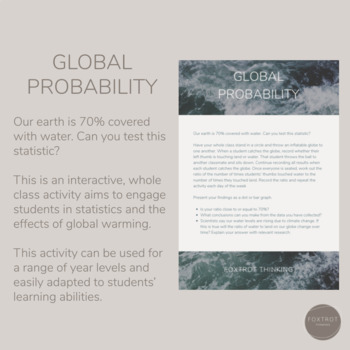
Global Probability
Foxtrot ThinkingOur world is 70% covered in water. A whole class activity, can we test this statistic? This activity is a fun and interactive approach to statistics and the effects of global warming. Suitable for all year levels, this activity can be easily adapted to all students' learning abilities.
Subjects:
Grades:
3rd - 6th
Types:
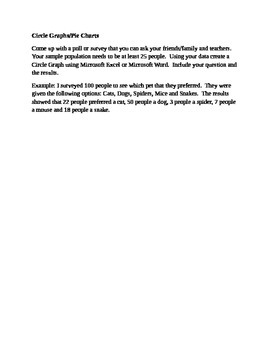
Circle Graphs/Pie Charts
Algebra 1 mini project on Circle Graphs/Pie Charts.
Subjects:
Grades:
6th - 10th, Higher Education, Adult Education, Staff
Types:
WHEN DO I USE? How to Select an appropriate Statisticial Method
The most common question that I am ask by research students is, "What is the most appropriate statistical method that I should use to analyze my data?"
Subjects:
Grades:
12th, Higher Education, Staff
Showing 1-24 of 24 results


