43 results
3rd grade statistics independent work packets for staff
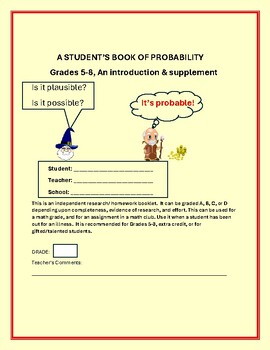
PROBABILITY: A STUDENT'S ACTIVITY/KNOWLEDGE BOOKLET GRADES 5-8, MG, & MATH CLUB
This is an independent activity booklet on probability. It is designed to enhance the learning of this mathematical theory. It has real life applications, a quiz, quotes, mystery quiz, biographies, and a writing prompt, etc. The intent is to show students how math is an integral part of life, and its functions. Answer keys are included. There is an art-design component for 2 activities, as well. This is a beginner-introduction/ supplement to this topic. Excelsior! Thank you ever so much for
Subjects:
Grades:
5th - 8th, Adult Education, Staff
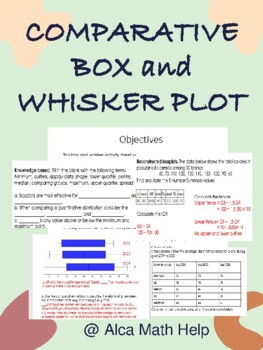
Comparison Box and Whisker Plots Worksheet, Quiz, Test for Stats & AP Stats
This box and whisker activity sheet was designed to test students understanding of the 5 number summary data values given quantitative data sets. Perfect for students in grade 10-12 doing statistics and you want to give them a challenge and should be manageable for students doing AP STATSAt the end of this activity students should be able to1. Students should be able to explain and construct box plots showing the different regions and what they represent. 2. Students should also be able to use
Subjects:
Grades:
11th - 12th, Higher Education, Adult Education, Staff
CCSS:
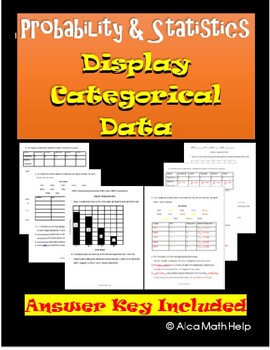
Categorical Data Display Pie Chart & Bar Chart: Worksheet, CW, HW CP & AP Stats
If you are looking for an easy to follow for students. You are at the right place. This is a quick and easy to follow activity sheet that brings across the concept clear and precise. Teachers in my department love this activity sheet. This is useful of CP Probability and Statistics, AP Statistics and Algebra 1 statistics unit. Categorical data and Display Variables ObjectivesAt the end of the lesson students should be able to:1. Correctly define categorical and quantitative data with examples2.
Subjects:
Grades:
8th - 12th, Higher Education, Adult Education, Staff
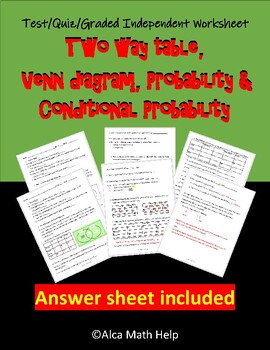
Unit Test/Quiz/Packet- Two-way table, Venn diagram, Conditional Probability
If you are looking for an easy to follow for students. You are at the right place. This is a quick and easy to follow activity sheet that brings across the concept clearly and precisely. Teachers in my department love this activity sheet. This is useful for CP Probability and Statistics, AP Statistics and Algebra 1 statistics unit.5W’s and How of statisticsAt the end of the lesson students should be able to:1. Recall the history of statistics2. Define the 5W’s and How of statistics with example
Subjects:
Grades:
9th - 12th, Higher Education, Adult Education, Staff
CCSS:
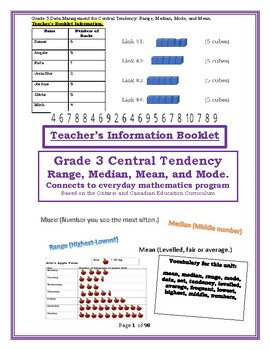
Grade 3 Data Management for Central Tendency: Range, Median, Mode, and Mean.
Grade 3 Unit 13: Data Management for Central Tendency: Range, Median, Mode, and Mean.Please see “Preview” for more information on the complete workbook. Grade 3 Maths Program Based on the Ontario and Canadian Curriculum. 100% connected to the Ontario and Canadian 2022 Curriculum with a rubric.With Connections to EQAO sample questions from 2006 to 2022, to introduce the math language to the grade 3 students. Save time and money on your maths program. No need to copy; stress the
Subjects:
Grades:
3rd, Staff
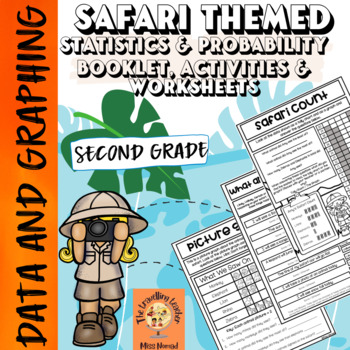
Second Grade Math: Data & Graphing Printable Booklet, Worksheets & Activities
This African Safari Themed Data & Graphing Printable Worksheets and Activity Pack features 19 different pages of printables and activities. This resource will bring the excitement of a safari and the students' love of animals into your maths lessons! It has minimal preparation, only requiring you to print the copies for your students with a fun activity at the end. It also comes with an answer key!This resource has been designed and aligned with the Year 2 Australian Curriculum, however, it
Subjects:
Grades:
1st - 3rd
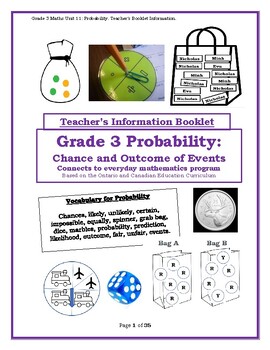
Grade 3 Maths Unit 11: Probability.
Grade 3 Maths Unit 11: Probability.Please see “Preview” for more information on the complete workbook. Grade 3 Maths Program Based on the Ontario and Canadian Curriculum. 100% connected to the Ontario and Canadian 2022 Curriculum with a rubric.With connections to provincial sample questionings, to introduce the math language to the grade 2 students. Save time and money on your maths program. Connects to many of the grade 2 social sciences, including financial and coding curriculum. Social Emo
Subjects:
Grades:
3rd
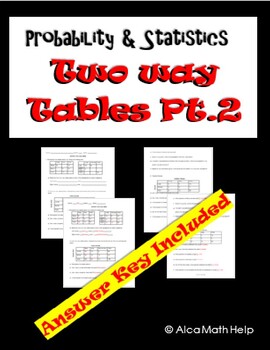
Probability & Statistics- Two-Way Table Worksheet, Homework, Quiz, AP Review
If you are looking for an easy to follow for students. You are at the right place. This is a quick and easy to follow activity sheet that brings across the concept clearly and precisely. Teachers in my department love this activity sheet and the students enjoy it. This is useful for CP Probability and Statistics, AP Statistics and Algebra 1 Statistics unitAt the end of the lesson students should be able to:1. Define two-way tables with its properties.2. Create two- way tables using frequency co
Subjects:
Grades:
9th - 12th, Higher Education, Adult Education, Staff
CCSS:
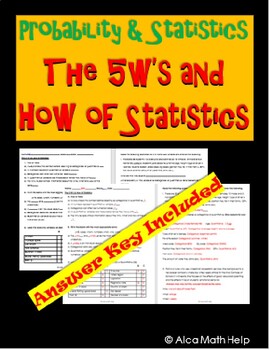
The 5W's & How of Statistics Worksheet, CP Stats, AP Stats, HW, Back-to-School
If you are looking for an easy to follow for students. You are at the right place. This is a quick and easy to follow activity sheet that brings across the concept clearly and precisely. Teachers in my department love this activity sheet. This is useful for CP Probability and Statistics, AP Statistics and Algebra 1 statistics unit.5W’s and How ObjectivesAt the end of the lesson students should be able to:1. Recall the history of statistics2. Define the 5W’s and How of statistics with examples3.
Subjects:
Grades:
8th - 12th, Higher Education, Adult Education, Staff
CCSS:
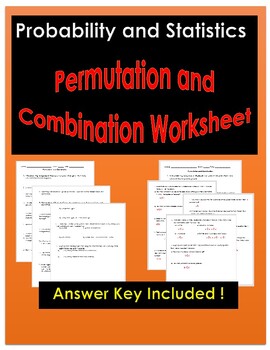
Permutation and Combination Worksheet/Activity/Packet | Alca Math Help
If you are looking for an easy to follow for students. You are at the right place. This is a quick and easy to follow activity sheet that brings across the concept clearly and precisely. Teachers in my department love this activity sheet. This is useful for CP Probability and Statistics, AP Statistics and Algebra 1 statistics unit.Objectives1. Recognize the difference between permutation and combination.2. Use the fundamental counting principle: or/and.3. Correctly use both formula either by ha
Subjects:
Grades:
9th - 12th, Higher Education, Adult Education, Staff
CCSS:
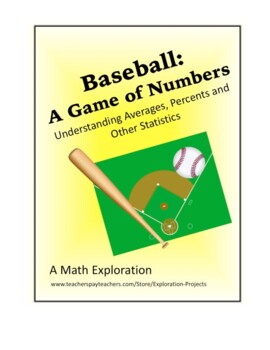
Math- Baseball: A Game of Numbers
In this Exploration, students will examine the statistics of four baseball players. The focus is to understand how the data is calculated. This classic American sport has always used math to keep track of everything that happens in the game. This math Exploration includes detailed, student-friendly Steps to Success that lead the learner through the process of creating a high-level, quality independent project. To add rigor and thoughtfulness, students reflect on their Exploration by answering s
Subjects:
Grades:
3rd - 8th
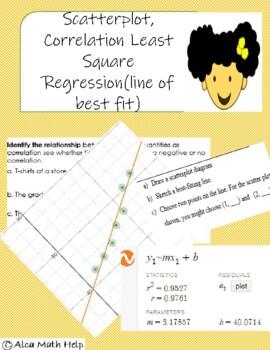
Scatterplot, Correlation and Least Square Regression (line of best fit)
At the end of this activity Students will be able to:1.Calculate the slope of a using points from the line of best fit.2.Estimate the strength and relationship between variables using a scatterplot.3.Explain correlation given the correlation coefficient4.Know facts about correlation●Answer Key included!●This activity sheet can be used as a Unit Quiz, Classwork or HomeworkIt comprises of short answer and true or false optionsPlease follow me by clicking this link
Subjects:
Grades:
11th - 12th, Higher Education, Staff
CCSS:
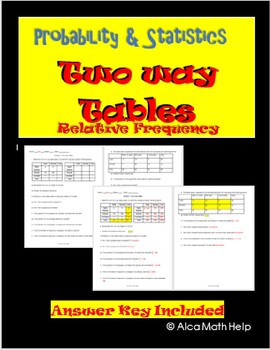
Two-Way Tables Worksheet, Homework, CW, Review, Quiz for CP Stats, AP Stats
If you are looking for an easy to follow for students. You are at the right place. This is a quick and easy to follow activity sheet that brings across the concept clear and precise. Teachers in my department love this activity sheet. This is useful of CP Probability and Statistics, AP Statistics and Algebra 1 statistics unit. Frequency Tables ObjectivesAt the end of the lesson students should be able to:1. Define two-way tables with its properties.2. Create two-way tables using frequency count
Subjects:
Grades:
10th - 12th, Higher Education, Adult Education, Staff
CCSS:
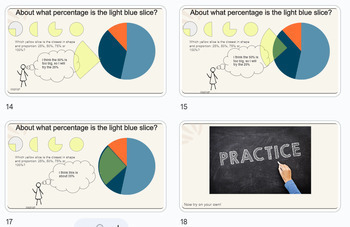
Estimating Percentages 2: Circle Graphs
This mathematics Slide Deck resource is intended to support learners working on Virginia Standard of Learning:6.NS.1 a)Estimate and determine the percent represented by a given model (e.g., number line, picture, verbal description), including percents greater than 100% and less than 1%. This material was development for 1:1 review and tutoring. Teachers may find it useful for younger learners and students receiving special/exceptional education as well as with students learning in states other
Subjects:
Grades:
3rd - 6th
CCSS:
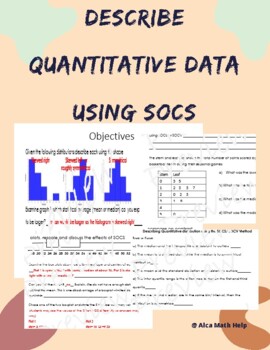
Describe Quantitative Data using SOCS/SOCV- Box plot, Histogram, Stem plot
If you are looking for a worksheet that can be used as a quiz, test, review packet you are at the right place. This activity sheet is suitable for students doing AP Stats and CP Probability and Statistics. This activity sheet allows students to:Use prior knowledge to answer true false questions and fill in the blanks with vocabulary provided.Describe box plots, histogram and stem plot using SOCS.Interpret the shape, center, outlier or any unusual feature along with the spread.
Subjects:
Grades:
11th - 12th, Higher Education, Adult Education, Staff
CCSS:
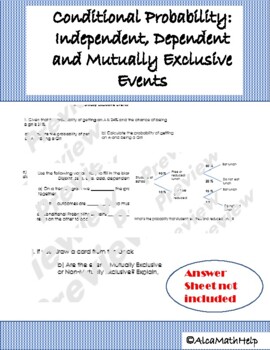
Conditional Probability: Independent, Dependent and Mutually Exclusive Events
If you are looking for an assessment piece that is suitable for classwork, pop quiz, quiz, mini test, or homework. you have the right piece. If you want students to work together independently, in pairs or small group this activity is also appropriate. Students should have knowledge of* How to calculate probability* Sample space/ equally likely outcome* Venn diagram and their parts (union, intersection, Only, neither) At the ed of the lesson activity students will be able to:a) examine and comp
Subjects:
Grades:
10th - 12th, Higher Education, Adult Education, Staff
CCSS:
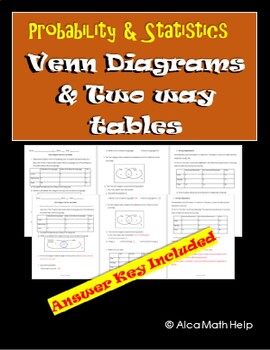
Venn Diagrams and Two-way table Worksheet CP Probs, Homework
If you are looking for an easy to follow for students. You are at the right place. This is a quick and easy to follow activity sheet that brings across the concept clearly and precisely. Teachers in my department love this activity sheet. This is useful for CP Probability and Statistics, AP Statistics and Algebra 1 statistics unit-Venn diagram ObjectivesAt the end of the lesson students should be able to:1. Identify a Venn diagram and its properties2. Shade specific regions of the Venn diagram(
Subjects:
Grades:
8th - 12th, Higher Education, Adult Education, Staff
CCSS:
Complete Grade 2 Math Activity Bundle | Digital and Print
Complete Grade 2 Math Activity Bundle | Digital and PrintDiscover the ultimate 2nd Grade Math Center Activities Pack! This comprehensive curriculum includes interactive and differentiated lessons, aligned with 2nd-grade math standards. Your students will love the gamified approach, while you'll appreciate the time-saving resources. Assessments and real-world connections included! Foster collaborative learning and independence with these teacher-friendly materials. Parents will love being part of
Subjects:
Grades:
2nd - 3rd
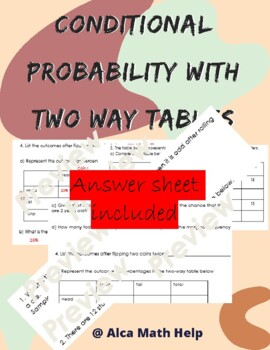
Conditional Probability and Two-way tables AP Stats/ CP Probability and Stats
This activity is design as a practice sheet: classwork or homework or mini quiz. It aims to extend students understanding of probability by teaching the students about conditional probability with two-way tables. Students can work collaboratively or independently.This can also be utilized by students doing AP STAT as bell work pop quiz or any assessment you decide.Feel free to follow me at https://www.teacherspayteachers.com/Sellers-Im-Following/Add/Alca-Math-Help so you can know when the free p
Subjects:
Grades:
10th - 12th, Higher Education, Adult Education, Staff
CCSS:
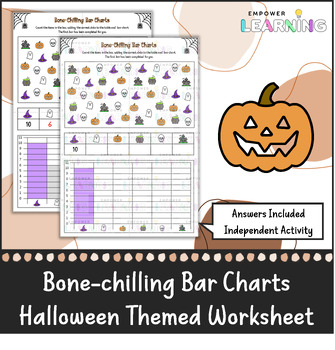
Bone-chilling Bar Charts - Halloween Math Worksheet
Bone-chilling Bar ChartsEngaging Halloween worksheet on bar charts, requiring students to count items, fill in a table and then construct a bar chart using this information. This resource comes with an answer key with completed table and bar chart.
Subjects:
Grades:
3rd - 8th
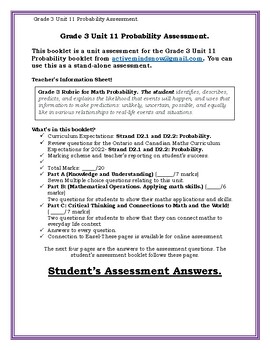
Grade 3 Unit 11 Probability Assessment.
Grade 3 Unit 11 Probability Assessment. This booklet is a unit assessment for the Grade 3 Unit 11 Probability booklet from activemindsnow@gmail.com. You can use this as a stand-alone assessment. Teacher’s Information Sheet!What’s in this booklet?Curriculum Expectations: Strand D2.1 and D2.2: Probability.Review questions for the Ontario and Canadian Maths Curriculum Expectations for 2022- Strand D2.1 and D2.2: Probability.Marking scheme and teacher’s reporting on student’s success. Total Marks: _
Subjects:
Grades:
3rd
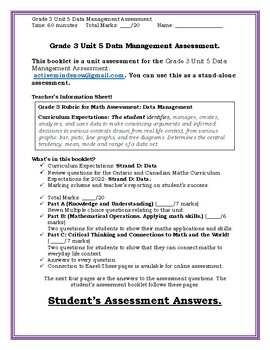
Grade 3 Unit 5 Data Management Assessment.
Grade 3 Unit 5 Data Management Assessment. This booklet is a unit assessment for the Grade 3 Unit 5 Data Management from activemindsnow@gmail.com. You can use this as a stand-alone assessment. Teacher’s Information Sheet! What’s in this booklet?Curriculum Expectations: Strand D: DataReview questions for the Ontario and Canadian Maths Curriculum Expectations for 2022- Strand D: Data.Marking scheme and teacher’s reporting on student’s success. Total Marks: _____/20Part A (Knowledge and Understand
Subjects:
Grades:
3rd
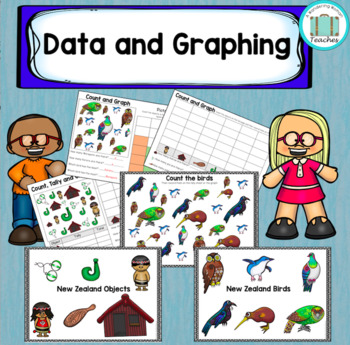
Math Data and Graphing NZ - Home Learning Packet
This set will help your students to practise their skills by collecting data, representing it as tally marks, bar charts or pictographs and interpreting the data by answering questions. It features differentiated worksheets to help you cater for the different abilities in your classroom. These work well for individual practise at home or school, group work, centres or homework. These sheets can be shared with families at home by email or on Seesaw for ONE class only. Included NZ Achievement Obj
Subjects:
Grades:
1st - 3rd
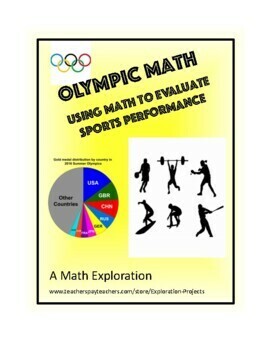
Math- Olympic Math:Using Math to Evaluate Sports Performances
Students will look at the Olympic games through a mathematical lens. Using their mathematical thinking they will use data and research to create graphs and story problems. If you are doing this Exploration during an Olympic year, students can use the data from this year. If there are no Olympics happening this year, choose a historic Olympics to analyze.This math Exploration includes detailed, student-friendly Steps to Success that lead the learner through the process of creating a high-level,
Subjects:
Grades:
3rd - 8th
Showing 1-24 of 43 results


