Medical Trial -- Elementary Data Edition - Medical - 21st Century Math Project
- Zip
- Google Apps™

Also included in
- 12 of my best projects/units all in an organized money saving bundle! These engaging, student/teacher approved math projects that provide rigor, relevance, and cross-curricular content altogether. I have each of these projects advertised separately these projects are $65, so this is over 30% off!.Price $45.00Original Price $70.00Save $25.00
- The project is the core of what I have built my classroom around. Scaffolding learners to real world projects. This bundle includes the 105+ math projects I have written. This is over 2,700 pages of content.21st Century Math Projects each scaffold through an authentic context and math skill buildingPrice $395.00Original Price $564.00Save $169.00
Description
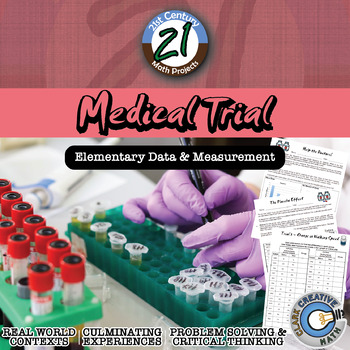
Bring your students into the world of double blind medical studies. Every day, doctors and hospitals rely on scientific studies and research to make healthcare decisions for patients. Are some medicines more effective than others? Do certain types of patients benefit more from certain types of treatments? Due to the security of medical records, studies are somewhat limited in their scope and are generally carried out at universities and research hospitals. At these facilities ground breaking work is being made every day. Behind all of the work is careful statistical analysis. This is an elementary version of that type of work!
In this 21st Century Math Project, students will complete a variety assignments related to the measurement and data strands of the 3rd and 4th Grade Common Core Standards focusing on bar graphs, line graphs, pictographs and line plots. ***THIS PRODUCT HAS BEEN UPDATED WITH A GOOGLE SLIDES INTERACTIVE VERSION INCLUDED. REDOWNLOAD IF YOU HAVE IT ALREADY***
Included in this file are:
-- In “Help the Doctors”, students will are given four different situations using four different types of data displays (bar graphs, line graphs, pictographs and line plots). The idea is that they help doctors decide if their new ideas work better than their old ideas (experimental and control groups for the big kids!) This can work as a station for four separate days or an as extended math activity.
-- In “Placebo Effect”, students are given two groups of data and are asked to create either bar graphs or line plots of it. They will compare the results from a group that gets medicine and a group that gets a placebo. Could the placebo effect be a real thing? This is practice for the final projects…
-- In “Medical Trial”, students can work in a team of medical researchers. There are four different medical trials included which can be used for 4 different groups. Within each trial there is an experiment and a traditional treatment being analyzed. The goal of the research is to determine if the experimental treatment is significantly different than the typical treatment.
To conclude the project, students can write an article for a medical journal. I have set this up with a Pre-Writing exercise that will be structured loosely like a college level research article. Of course it won’t be as lengthy or rigorous, but it aims to get students familiar with that structure.
In this 43 page document you will be given a mapping to the Content Standards, an outline for how to implement the project, 2 prep assignments and the final project. Download the preview to see it all.
You may be interested in the following discounted bundles. SAVE $$$!
•21st Century Math Projects -- All the Projects
Need an Entire Curriculum?
•21st Century 3rd Grade –- the Entire Curriculum
•21st Century 4th Grade –- the Entire Curriculum
For more tips, tricks and ideas check out the Clark Creative Education Blog
And join our community where I post ideas, anecdotes, elaborations & every once in a while I pass out TPT gift cards! And jokes! I do jokes too!


