278 results
3rd grade statistics lessons for staff
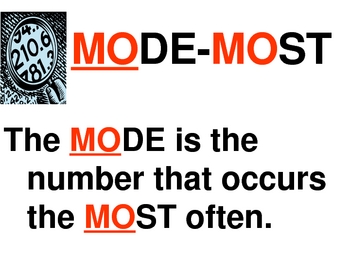
Statistics Mean, Median, Mode & Range Interactive PowerPoint by Erica
Introduce statistics including mean, median, mode and range with this colorful, interactive 22 slide PowerPoint. This interactive PowerPoint introduces each term and teaches a strategy for finding the value. There is also a trick or visual to help students remember the steps to find each one (mean, median, mode and range). Students are able to practice finding the mean, median, mode and range and then check within the PowerPoint. This is excellent for a statistics lesson or for students to e
Subjects:
Grades:
3rd - 6th
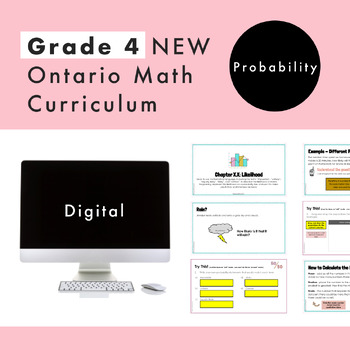
Grade 4 Ontario Math - Probability - Digital Google Slides + Form
Are you planning for the NEW Grade 4 Ontario Math Curriculum? This editable Google Slide and Google Form resource is what you need! This resource is for the DATA strand and and covers specific expectations for “D2. Probability”. In this resource, students will experience math through engaging real-life questions, storytelling through math, and interactive slides. What’s Included2 Google Slide presentations45 UNIQUE and EDITABLE Google Slides in totalSlides are editable for you to increase stud
Subjects:
Grades:
3rd - 5th
Types:
Also included in: Grade 4 NEW Ontario Math Curriculum Full Year Digital Slides Bundle
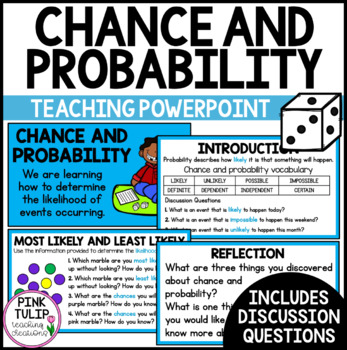
Chance and Probability - Teaching PowerPoint Presentation
Chance and Probability - Teaching PowerPoint PresentationCurriculum aligned PowerPoint presentation to guide explicit teaching of chance and probability, including likelihood. Includes:Learning intention.Introduction (tune in). Engaging graphics.Detailed explanations of various chance events.An in-depth vocabulary of terms such as likelihood, probability, chance, independent, dependent, and impossible.Discussion questions with answers.Reflection slides.Glossary. US spelling and UK spelling vers
Subjects:
Grades:
3rd - 5th
Also included in: Math PowerPoint Presentations Bundle
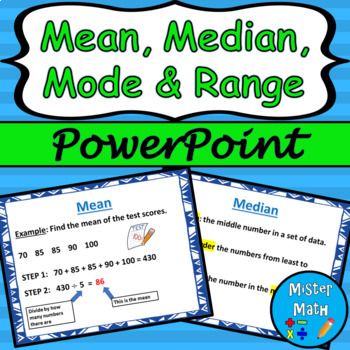
Mean, Median, Mode & Range PowerPoint Lesson
This is a PowerPoint Lesson to assist students in learning about finding the mean, median, mode, and range of data sets. The PowerPoint includes key vocabulary, as well as an example for each skill. Plenty of real-life examples are included to give students ample opportunities to connect the skills to the real world. The presentation also comes fully animated, with animations triggered by mouse click (or presentation pointer!)This PowerPoint lesson is also part of a BUNDLE that includes a guided
Subjects:
Grades:
3rd - 6th
Also included in: Mean, Median, Mode & Range PPT and Guided Notes BUNDLE
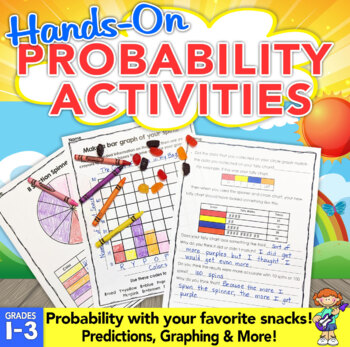
Probability Activities: Hands-On Probability with Snacks!
Probability activities are fun and engaging when you add treats! These fun probability activities allow students to experiment with probability using snacks.Students will use probability to predict, investigate, record data, and learn to use words to describe the chances of something happening.Students will love these probability activities because they are using skills with snacks! Each of the probability activities builds on each other and guides them step-by-step. Easy prep to print off the p
Subjects:
Grades:
1st - 3rd
Types:
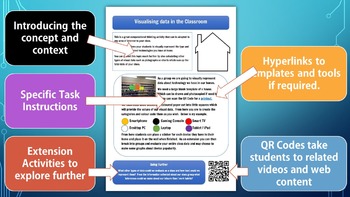
Computational Thinking & Data Analysis Task Cards | STEM | Digital Technologies
Most kids don’t naturally think like PROGRAMMERS, but you can enjoy the satisfaction of seeing them have a COMPUTATIONAL THINKING ⚡“A-ha!”⚡ moment as they learn with these visual, hands-on, NO PREP STEM activities.For those students who learn best by seeing, doing, and getting their hands dirty, this activity and card set will make abstract computing concepts as real as the classroom they’re sitting in. This pack uses students’ everyday interests, such as sports and friends, to teach them how al
Grades:
3rd - 8th
Types:
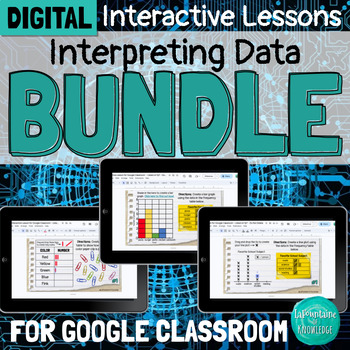
DIGITAL Interpreting Data Interactive Lesson Bundle for Google Classroom
This bundle of 3 digital interactive math lessons for Google Classroom teaches interpreting categorical and numerical data using frequency tables, bar graphs, and line plots. Each lesson includes: a video lesson (YouTube and Loom viewing options included) practice problems and activitiesteacher directions and answer keysThese lessons are ready to assign and easy for students to complete independently. Students will learn:important vocabulary - title, categories, tally marks, key, categorical dat
Subjects:
Grades:
3rd - 5th
Types:
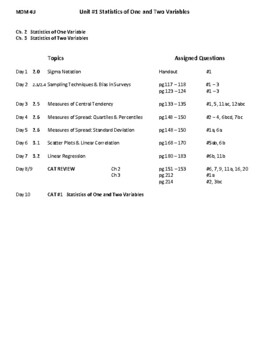
MDM4U Data Management Grade 12 ONTARIO CURRICULUM MHR textbook Entire course
MDM4U Grade 12 Data Management Ontario Curriculum MHRGreat for the classroom or online learning.This package includes over 125 organized and labeled files (using folders for units) created by a teacher with over 20 years of experience. This package would be great for any teacher who needs a specific outline of the calculus part of the course and does not want to do any lesson planning. Would also be great for any student who wants to study to the in depth completed notes.This course was develope
Subjects:
Grades:
12th, Staff
Types:
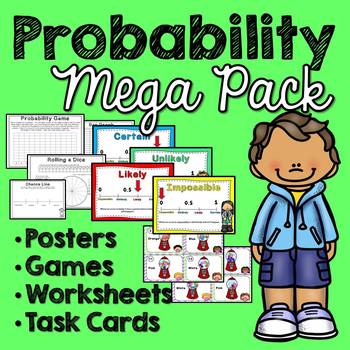
Probability (What are the Chances?) No Prep
Probability – What are the Chances? MEGA PackThis pack contains everything you need to help your students understand Probability and Chance with hands-on activities. This pack contains the following posters, games, worksheets, task cards and activities: 4 Posters – Certain, Impossible, Likely and Unlikely.Rolling a Dice ActivityBar Graph – Data Dice InvestigationProbability Game with DiceSpinner ActivitiesChoose the SpinnerCandy Math – FractionsCandy Math - Pie GraphCandy Math – Bar GraphCan
Subjects:
Grades:
1st - 4th
Types:
Also included in: Distance Learning Bundle (Grades 3-5) No Prep
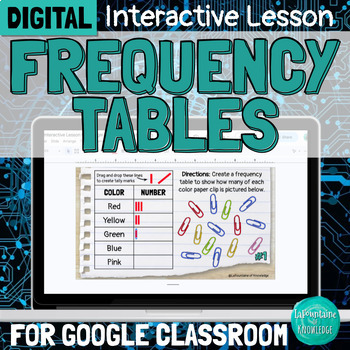
DIGITAL Frequency Tables Interpreting Data Interactive Lesson
This interactive Google Slides lesson introduces students to frequency tables and demonstrates how to interpret both categorical and numerical data. The lesson covers:the parts of a frequency table (title, categories, and tally marks)the difference between categorical and numerical datahow to interpret data (answer questions) using a frequency tablehow to create a frequency table This resource includes:a 9 minute video lesson (YouTube and Loom viewing options provided) 14 practice problems - stu
Subjects:
Grades:
3rd - 5th
Types:
Also included in: DIGITAL Interpreting Data Interactive Lesson Bundle for Google Classroom
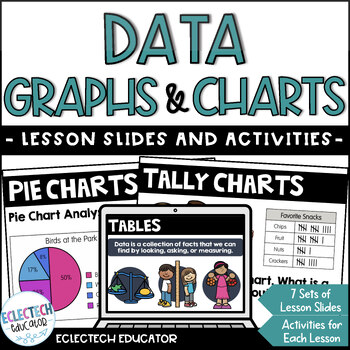
Data Management Collection, Charts and Graphs Digital Slides & Activities
Looking for fun ways to have students understand data? This math resource has everything you need to help students collect, describe, and represent statistical information using a variety of graphs and charts, such as bar graphs and pie charts. The SEVEN lessons, each with lesson slides, information, interactive activities, and practice questions, provide many opportunities to collect and represent data. TOPICS:⭐ Tables⭐ Tally Charts⭐ Bar Graphs⭐ Pictographs⭐ Pie Charts⭐ Line Plots⭐ Line GraphsE
Subjects:
Grades:
3rd - 4th
Types:
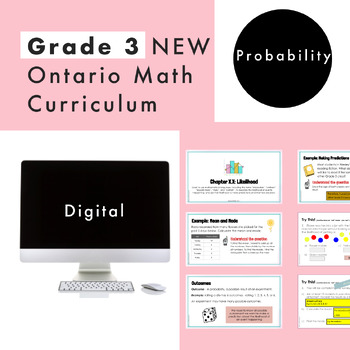
Grade 3 Ontario Math - Probability - Digital Google Slides + Form
Are you planning for the NEW Grade 3 Ontario Math Curriculum? This editable Google Slide resource is what you need! This resource is for the DATA strand and covers ALL specific expectations for “D2. Probability". In this resource, students will experience math through engaging real-life questions, storytelling through math, and interactive slides. What’s Included2 Google Slide presentations48 UNIQUE and EDITABLE Google Slides in totalSlides are editable for you to increase student engagement (
Subjects:
Grades:
2nd - 4th
Types:
Also included in: Grade 3 NEW Ontario Math Curriculum Full Year Digital Slides Bundle
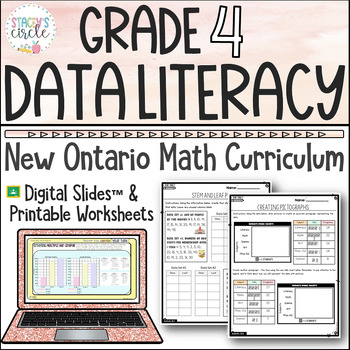
Grade 4 Data Literacy Ontario Math Digital Slides | Worksheets | Assessments
This product includes a comprehensive unit covering the entire Grade 4 Data Literacy Strand from the NEW Ontario 2020 Math Curriculum (ExpectationsD2.1, D2.2, D2.3, D2.4, D2.5, D2.6). Your purchase comes with 107 digital slides as well as printable practice, including tickets out the door, and includes 3-part lessons, activities and skill practice, FULLY EDITABLE digital and printable assessment, and social-emotional learning skills.Hey Grade 4 Ontario Teachers! You'll want this in your collecti
Subjects:
Grades:
3rd - 5th
Types:
Basic Statistics Year Long Lesson Plan Bundle
Prepare to embark on an exhilarating journey through the realm of statistics with our meticulously crafted nine-lesson plan designed to engage and captivate your students' minds. Each session is a vibrant exploration of statistical concepts, infused with excitement, interactivity, and depth. From introducing the basics of data analysis to delving into advanced techniques, our lessons are brimming with hands-on activities, animated discussions, and real-world applications that will ignite a passi
Subjects:
Grades:
11th - 12th, Staff
Elementary Jelly Bean Probability Game
Enjoy this awesome probability game using jelly beans for an introduction to making predictions based on probability. Extremely engaging for students practicing these skills!This would be best used for Grades 3-6!Please rate me and leave feedback.
Subjects:
Grades:
3rd - 6th
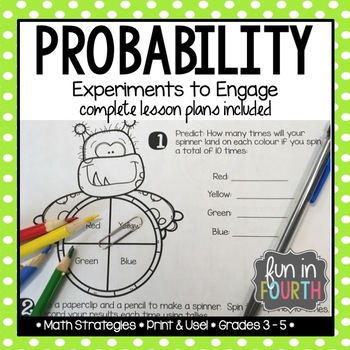
Probability Experiments Unit - Lessons and Assessment
Engage your students through hands-on experiments while learning about probability! This package contains:♥ Lesson 1: Introduction to Probability♥ Lesson 2: Probability with Spinners♥ Lesson 3: What's in the Bag?♥ Lesson 4: Dice Rolling♥ Lesson 5: Coin Flipping♥ Lesson 6: Cereal Box Prizes♥ Probability Assessment (test and two different assessment rubrics)♥ Digital Google Forms™ version of the assessment♥ Vocabulary CardsThis resource perfectly aligns with the *new* Grade 4 Mathematics Curricu
Subjects:
Grades:
3rd - 5th
Types:
Also included in: Grade 4 Math Bundle
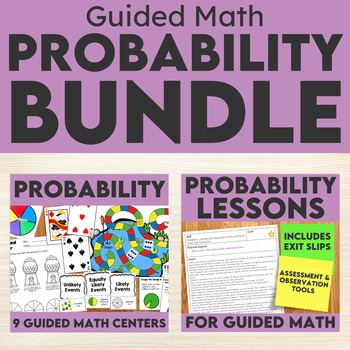
Probability Lessons and Centres Bundle for Guided Math - Differentiated
These hands-on guided math probability lessons and centres will engage students in authentic, meaningful learning activities while you work with student groups! These best-selling math centres and lessons are a must-have for your classroom!⭐ The probability activities in this bundle are also available in a Year-Long Bundle with all my other Guided Math resources!This set of probability centres and lessons is perfect for:✔ 2nd and 3rd-grade classrooms✔ teachers who don't want to prep math activit
Subjects:
Grades:
2nd - 3rd
Types:
Análisis de datos y Probabilidad: Pictogramas y Tablas de frecuencias Gr. 3-5
Obtén una mayor comprensión sobe los pictogramas y las tablas de frecuencia con este atractivo recurso. Los conceptos incluyen: pictogramas, suma, tablas de frecuencia, resta. Este recurso, redactado para los estudiantes de tercer a quinto grado, se divide en tres secciones: Hojas de tarea con problemas de texto, seguido por Hojas de simulacro para practicar la competencia de los estudiantes en las habilidades procesales, y finalmente una prueba de evaluación. La clave de respuestas está incluid
Subjects:
Grades:
3rd - 5th
Types:
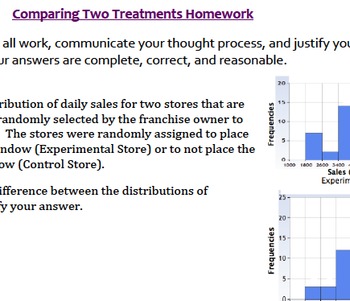
Data Analysis & Statistics Bundle (Ideal for Algebra II) Common Core High School
The problems and activities within this document are designed to assist students in achieving the following standards: S.ID.4, S.IC.1, S.IC.2, S.IC.3, S.IC.4, S.IC.5, S.IC.6, S.CP.A.2, S.CP.A.3, and S.CP.A.5, as well as the standards for mathematics practice and the literacy standards. They are also designed to help the teacher assess the students’ abilities when it comes to working with the ideas within the standards.
This folder contains the following:
- Introduction to data, statistics, and
Subjects:
Grades:
6th - 12th, Higher Education, Adult Education, Staff
Types:
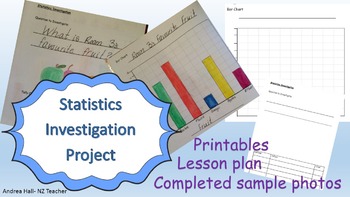
Statistics Investigation Project
This is more than a Graphing lesson plan or worksheet. By the end of the 3 lessons the students proudly present their statistics project booklet with data collected, presented and analysed.
Tried and true, I have used this lesson and project booklet in my class many times and it scaffolds the process for young students ages 7-8 years old to complete a bar chart, which can be difficult.
The project booklet becomes evidence of learning with a self evaluation section and looks good on display.
Subjects:
Grades:
2nd - 4th
Types:
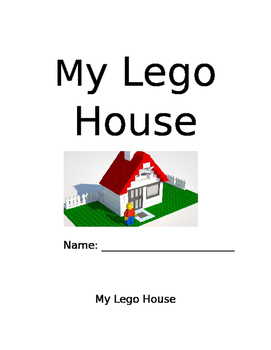
My Lego House
This is a 2-3 week maths project for anyone from Grade 3-6. Done in pairs or small groups the project entails students designing and building their own Lego house. In the project students will cover a range of maths concepts including area, perimeter, counting, money, graphing and interpreting data. The project includes a detailed teacher booklet with photographs of student's work and examples for each of the lessons. The student book is also included for students to work from, although we found
Subjects:
Grades:
3rd - 6th
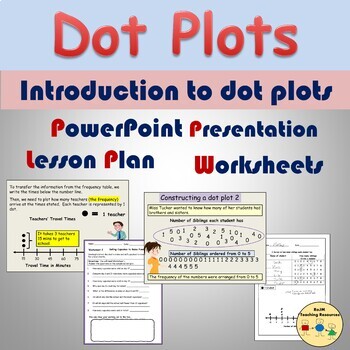
Dot Plots Line Plots Worksheets Presentation Frequency Tables Statistics
This resource relates to statistics on the topic of dot plots. It introduces dot plots on PowerPoint (12 Slides). The presentation demonstrates how the data was collected, rearranging data in numerical order, and presenting the data on a frequency table. Using the information on the frequency table, students are shown how to create a dot plot/line plot via Slide Show animation. Two detailed examples are shown. Content:· PowerPoint Presentation (12 Slides)· 1 Flexible Lesson Plan (1- 2 hrs)· 2 Se
Subjects:
Grades:
3rd - 5th
O Level Statistics 4040 Lesson plans, Thematic Unit Plans Full Syllabus Latest
Unleash the Power of Statistics with Our Comprehensive Lesson Plan Bundle! Title: O Level Statistics 4040 - Complete Editable Lesson Plans BundleDiscover the world of statistics with our comprehensive lesson plan bundle. "O Level Statistics 4040 - Complete Editable Lesson Plans Bundle" equips you with a treasure trove of editable resources, ensuring a thorough understanding of statistics for both educators and students. Key Features:✨ Full Syllabus Coverage: Our bundle covers the entire O Leve
Subjects:
Grades:
6th - 12th, Adult Education, Staff
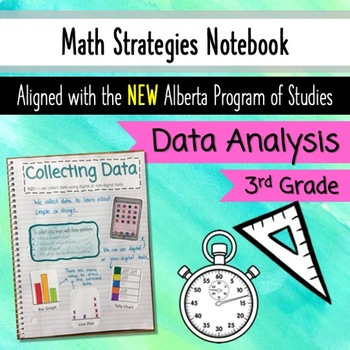
Math Data Analysis Unit - Grade 3 Alberta - Interactive Math Notebook
Interactive Math Notebook - Data Analysis Unit - Aligned with NEW Alberta Program of Studies for grade 3.This interactive Data Analysis Notebook will serve as a practical, engaging resource that students will use and reference throughout the entire year. It covers ALL 7 of your Data Analysis outcomes in grade 3.In this resource you will find:A cover page for your Interactive Math notebook,A 'Data Analysis' title page for this section of your Math notebook,An ”I Can statement” for each outcome (a
Subjects:
Grades:
3rd
Showing 1-24 of 278 results


