42 results
6th grade measurement Common Core 3.MD.B.3 resources
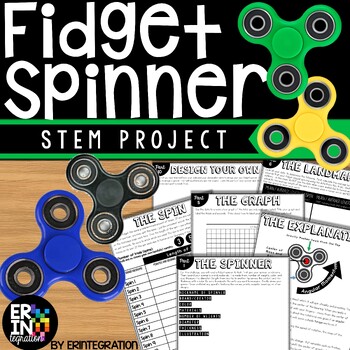
Fidget Spinner STEM Challenge Activities and Science Experiment
The ORIGINAL Fidget Spinner Stem Challenge & Science Lab! Discover the science of fidget spinners with this engaging and low-prep STEM activity. Practice scientific method with an exploration of variables, data collection, graphing, mean/average, and more...all while having fun!This self-paced, fidget spinner activity is print-and-go. Each activity sheet guides students through the project. STEM Challenge Overview:Students will use the included visual directions, graphic organizers, chart
Subjects:
Grades:
3rd - 6th
Types:
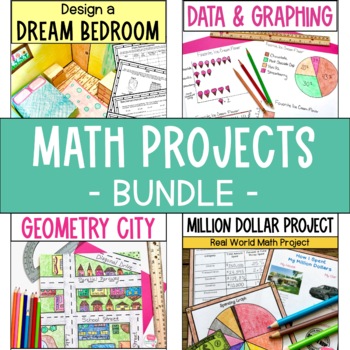
Math Projects - 4th and 5th Grade - Area, Perimeter, Angles, Graphing, Decimals
Your 4th and 5th grade students will love working on the engaging math projects included in this bundle! Use these real world math projects as end of unit activities, alternative ways to assess student learning, or fun ways to integrate math and art. You save 20% off the price of the individual resources when you purchase this bundle!Click the PREVIEW button to see more details of what is included.Projects Included in This Bundle:⭐ Design a Dream Bedroom - students will apply the skills of area
Subjects:
Grades:
4th - 6th
Types:
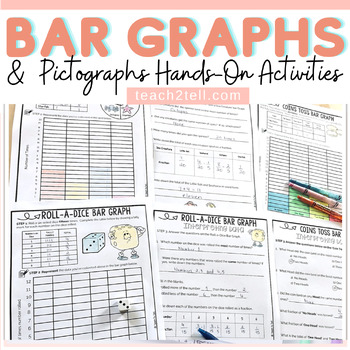
Bar Graphs Worksheets & Bar Graphs Activities Pictographs Picture Graphs
This collection of interactive worksheets feature interpreting data in bar graphs and pictographs. Data is collected using concrete materials such as visuals, dice, spinners, coins and M&M’s. This data is then represented in bar graphs and interpreted. The section on pictographs requires collected data to be interpreted.US and British English spellings and terminology files included.These no-prep printables facilitate students to move from the concrete to the abstract. Graphs target students
Subjects:
Grades:
3rd - 6th
Types:
CCSS:
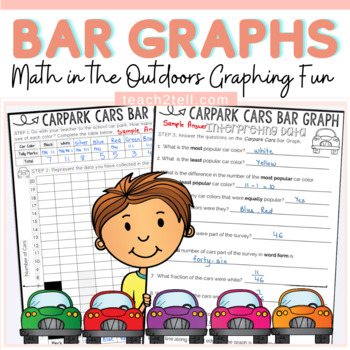
Bar Graphs Worksheets Collecting and Interpreting Data and Graphing Activity
Need a fun bar graphing and data collection activity? These free bar graph worksheets will get your students out of the four walls of the classroom and into the outdoors. Students will graph the car colors in the Staff Car Park. They will have the opportunity to use tally marks to collect data to construct a bar graph. A set of questions also require students to interpret the constructed bar graph. Not only will learning be more realistic but it will also be a welcome change, perhaps from the da
Subjects:
Grades:
2nd - 6th
Types:
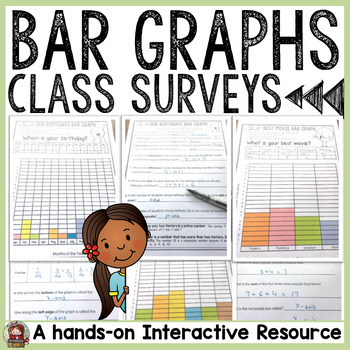
BAR GRAPHS: CLASS SURVEYS ACTIVITIES
BAR GRAPHS: SURVEYSThis Bar Graphs Class Surveys collection features collecting, graphing and interpreting data on topics your students will relate to. This is perfect for a getting-to-know-you back to school activity, or alternatively for applying graphing skills in real life situations.⭐ Separate folders featuring both British English and American spellings and terminology included.►What’s Included✅ 12 Class Surveys on topics of interest.✅ Choice of three Cover Sheets if compiling student su
Subjects:
Grades:
3rd - 6th
Types:
CCSS:
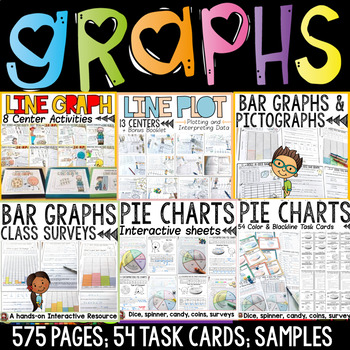
Bar Graphs Pictographs Line Graphs Line Plots Pie Charts Data Collection Bundle
The graphing bundle features interactive activities for creating and interpreting bar graphs, pictographs, line graphs, line plots and pie charts. Your entire graphing unit for a year!Separate folders featuring both British English and US spellings and terminology included.Great quality and value for this whopping 575 + page unit on graphing! Data is collected and interpreted using concrete materials such as visuals, dice, spinners, coins and other real-life objects and contexts. Further details
Subjects:
Grades:
2nd - 6th
Types:

Bar Graphs Whodunnit Activity - Printable & Digital Game Options
Nothing like a good criminal investigation to liven up bar graphs! Based off my popular CSI projects, I have created Whodunnits? The Whodunnits plan to focus on single content topics as opposed to units and will focus more on skill building than application. Every day can't be a project day, so Whodunnits can be an engaging out of their seat activity to practice important skills. In a Whodunnit?, students will work in teams to solve 10 practice problems that increase in difficult. After each ans
Subjects:
Grades:
3rd - 8th
Types:
CCSS:
Also included in: Pre-Algebra Whodunnit Activity Bundle - Printable & Digital Game Options

BAR GRAPHS BUNDLE: INTERACTIVE ACTIVITY SHEETS: PICTOGRAPHS: CLASS SURVEYS
1. BAR GRAPHS ⭐ Separate folders featuring both British English and American spellings and terminology included.***********************************************************************This graphing unit features interpreting data in bar graphs and pictographs. Data iscollected using concrete materials such as visuals, dice, spinners, coins and M&M’s .This data is then represented in bar graphs and interpreted. The section on pictographs requires collected data to be interpreted. These no prep
Subjects:
Grades:
3rd - 6th
Types:
CCSS:
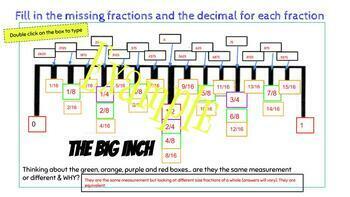
Measurement Galore - Reading a Tape Measure
This product come from struggling to teach students how to use the measuring tape and how to understand the fractions on a measuring tape. It has multiple representations of reading fractions on a measuring tape and fraction bar. It has spaces to type in answers and printable test pages to assess learning. It shows multiple ways to represent the same fraction (equivalent fractions). It is fun, yet rigorous. I included websites where your students can go to play online measurement games and vi
Grades:
3rd - 12th, Higher Education, Adult Education
Types:
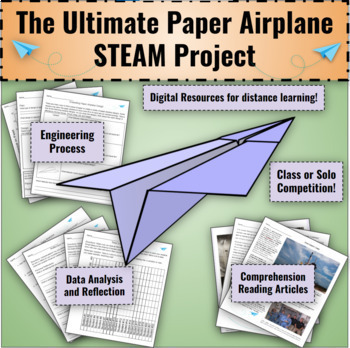
The Ultimate Paper Airplane STEAM Project: 10 Day Engineering Design Challenge
Every year since I started teaching, I've done a paper airplane contest. When I first started around 10 years ago, it was a quick contest that lasted just a few minutes. Gradually, as my experience as an educator grew, this project began to grow into what it is today... A 10 day cross-curricular mega project! I always say that student engagement is the key to learning, and I can almost guarantee that your students will be engaged during these activities! They will be measuring, graphing, reading
Subjects:
Grades:
3rd - 8th
Types:
NGSS:
3-5-ETS1-3
, 3-5-ETS1-1
, 3-5-ETS1-2
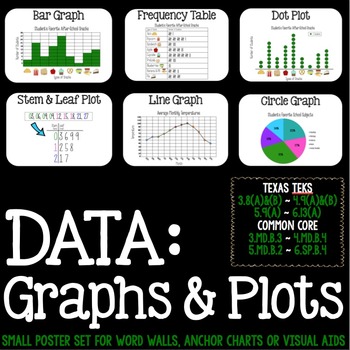
Math Vocabulary: Stem & Leaf, Dot Plots, Frequency Tables
This small poster set (each print out is 6.5 x 9.5) includes visual examples for:
- Bar Graph
- Frequency Plot
- Stem and Leaf Plot
- Circle Graph
- Line Graph
- Dot Plot
Great for word walls, anchor charts or visual aids in your classroom!
Subjects:
Grades:
3rd - 6th
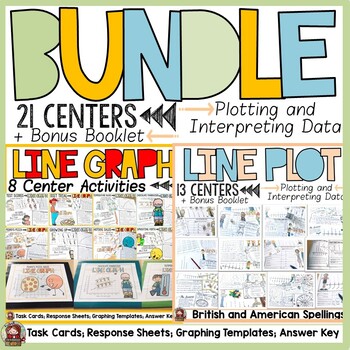
Line Graphs and Line Plots With Fractions and Whole Numbers Centers Bundle
Line Graphs and Line Plots with fractions and whole numbers feature interactive center activities. Data is collected using concrete materials such as visuals, dice, spinners, coins and other real-life objects and contexts. Further details about the graphs featured in this bundle are:1. LINE GRAPHSThis is a 145 page unit on Line Graphs that contains visual interactive activities to collate, record and interpret data in line graphs. Items Included8 center Activities (color and blackline): for eac
Subjects:
Grades:
3rd - 7th
Types:
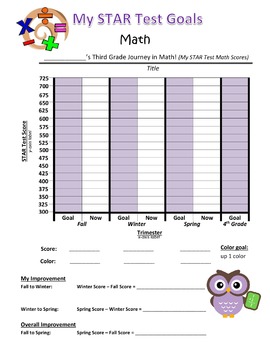
My STAR Test Goals - Student goal setting for standardized tests
This is a fully editable .DOC file that I have used to help my students set goals for their STAR test throughout the school year.
As a bonus, students can practice their measurement & data skills.
I have used this in a whole group setting, making an anchor chart with good test taking practices in order to help students brainstorm for the "two things I will do to reach my goal". I have also used this leading up to their STAR test and post STAR test during individual student conferencing.
Subjects:
Grades:
3rd - 8th
Types:
CCSS:
The Ultimate Paper Airplane STEAM Project + Escape Room: 10 Day Challenge
Every year since I started teaching, I've done a paper airplane contest. When I first started around 12 years ago, it was a quick contest that lasted just an afternoon. Gradually, as my experience as an educator grew, this project began to grow into what it is today... A 10 day cross-curricular mega project! I always say that student engagement is the key to learning, and I can guarantee that your students will be engaged during these activities! They will be measuring, graphing, reading, analyz
Grades:
3rd - 12th
Types:
NGSS:
MS-ETS1-2
, HS-ETS1-2
, 3-5-ETS1-3
, HS-ETS1-3
, MS-ETS1-4
...
MAP Math Practice: Data and Measurement (RIT Band 210-220)
This resource provides practice problems for the data and measurement strand of the NWEA Map test (RIT band 210-220). Problems are provided in multiple-choice worksheet form as well as task card form so that they can be used independently, in whole group review, or in small group centers, scavenger hunts, or even Scoot games.
Subjects:
Grades:
3rd - 6th
Types:
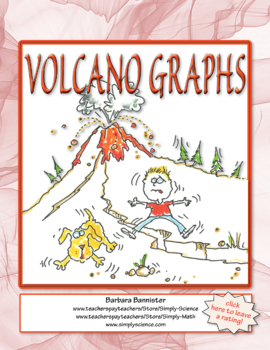
Graph Northwest Volcanoes Based on Location or Height
Quick and easy, just what you need to integrate science and math.Graph volcanoes based on location or height. Graph in meters or feet. Use prepared graphs or graph paper. I included my ten rules for graphing that you can format for your classroom using a Word™ file. I also included completed graphs so you'll have an answer key and students can compare their work to a completed graph.Thanks for visiting my Simply Science store. Please take a moment to leave a comment when you purchase a product.M
Subjects:
Grades:
3rd - 7th
Types:
CCSS:

Sports Day Investigation | Problem Based Learning PBL
This Sports Day - Investigation allows your students to work at their own pace with support from you. As they work through the tasks they will show the working out and record them in the booklet.Measurement are metric and imperial. Skills coveredLocationSpatial awarenessScaleCostingsSequence temperaturesMean, mode, medianGraphing Measurements Comparing statistics You will need to take a focus group or whole class focus to teach some concepts like mean, median and mode.At the conclusion of the i
Subjects:
Grades:
3rd - 6th
Types:
Also included in: Sport Bundle
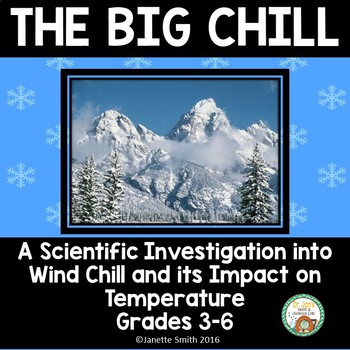
Temperature and Wind Chill: An Integrated Weather Activity
This engaging cooperative activity includes simulating a real life scenario to investigate the impact of wind and water on temperature. Math activities such as thermometer reading practice and making bar graphs are integrated within this activity.
Aligned to Next Generation and Common Core Standards.
Appropriate for grades 3-6.
Please leave feedback and earn TpT credits for future purchases.
If you like this download, you might also like these similar products:
Photosynthesis
Atomic Struc
Subjects:
Grades:
3rd - 6th
Types:
Also included in: Weather Super Bundle
Data Analysis Game - Small Group TableTop Practice Activity
Bring the TableTop Game revolution to your classroom! Board games are experiencing a renaissance and tapping into their innate engagement is a no brainer. This is the natural evolution of task cards. TableTop Math games cover a single unit of math study. The questions range from simple skill practice to application. Provided are four different game styles that can be played with the same set of math cards. Mix it up or let your students choose what to play. The choice is yours! In Journey, stude
Subjects:
Grades:
6th - 10th
Types:
Word Problems from The Hobbit, Part 2
Smaug to Bilbo: “A pony can only carry 200 pounds of treasure. How many ponies would you need to carry your one-fourteenth share of my treasure?”
Is Bilbo smarter than a 5th grader? He hadn’t thought of “cartage and tolls.”
This is the second set of story problems based on The Hobbit. The problems form a continuous narrative that can be read independently of the book or the movie.
This collection includes the events recounted in Chapters 8-13 in the book, which roughly corresponds to
Subjects:
Grades:
3rd - 6th
Types:
Leap Year STEM Challenge
The Leap Year STEM Challenge is a huge hit with my students. Their eyes light up when they see a STEM challenge on our agenda and your students will too! There is just something special about planning and building your own work and testing it to. It is so much fun to watch the concentration on their faces as they work out what they want to do and how they are going to do it, and their joy when they succeed. This challenge is one you must try!STEM activities provide the perfect opportunity for ha
Grades:
2nd - 7th
Types:
Also included in: Leap Year STEM Bundle

STEM-ersion - Bar Graphs Printable & Digital Activity - Wildlife Ranger
STEM-ersion assignments aim to immerse students in an authentic application within a STEM career. This STEM-ersion focuses on bar graphs. Students often ask what careers will use certain math skills and I think this is an opportunity to show them where the thinking is used! These problems aim to help students construct responses with my Evidence - Analysis - Conclusion framework that I use in all of my classes. These questions are carefully crafted not to have one correct answer, but to require
Subjects:
Grades:
3rd - 8th
Types:
CCSS:
Also included in: STEMersion - PRE-ALGEBRA BUNDLE - Printable & Digital Activities
Living and Nonliving Things Science Vocabulary Bingo Activity
This is a Science Activity Lesson based on the Science Standard about Living and Nonliving Things. It also ties in with Math Standards regarding creating and reading bar graphs and number lines. While that standard pertains to 3rd grade many other grades need to review and reteach it to help students. This activity helps ESL students and others to master the vocabulary for the science standard as well. This activity is a DOK level 2 and 4 but is not complicated. It will take 3 days and all paper
Subjects:
Grades:
3rd - 11th, Adult Education
Types:
CCSS:

Bar Graphs - - Printable & Digital Activity - Erin Gruwell Person Puzzle
Bring to life the traditional practice class or homework assignment with some global competency and diversity! While your students practice interpreting bar graphs, they can learn about the inspirational teacher Erin Gruwell!Person Puzzles are designed to highlight individuals with diverse backgrounds who have made significant contributions to our world. I typically use Person Puzzles as timed warm-ups which allows me to share a little about the person's background before my daily lesson. I can
Subjects:
Grades:
4th - 8th
Types:
CCSS:
Also included in: Person Puzzles PRE-ALGEBRA BUNDLE - Printable & Digital Activities
Showing 1-24 of 42 results


