27 results
6th grade statistics Common Core 3.MD.B.3 resources
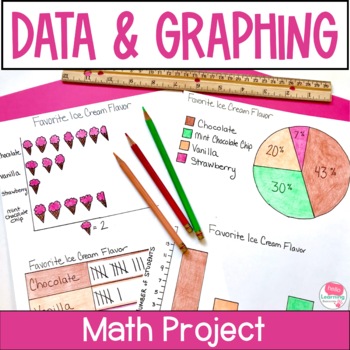
Data and Graphing Project - Real World Math Project Based Learning Activities
This data and graphing project gives your students a meaningful way to apply their data and graphing skills. Use this real world math project as an end of unit activity, enrichment activity or assessment. Easy to use and fun for students!Click the PREVIEW button above to see everything that is included in this fun math project!⭐ This resource includes:teacher information, directions and sample schedulesupply listgrading rubricstudent direction sheettwo data collection sheets (one for open ended
Subjects:
Grades:
4th - 6th
Types:
CCSS:
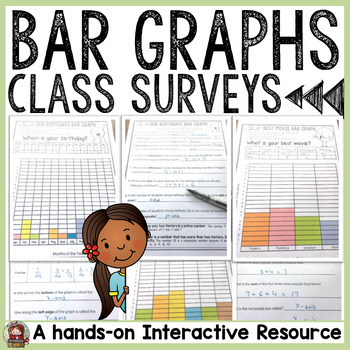
BAR GRAPHS: CLASS SURVEYS ACTIVITIES
BAR GRAPHS: SURVEYSThis Bar Graphs Class Surveys collection features collecting, graphing and interpreting data on topics your students will relate to. This is perfect for a getting-to-know-you back to school activity, or alternatively for applying graphing skills in real life situations.⭐ Separate folders featuring both British English and American spellings and terminology included.►What’s Included✅ 12 Class Surveys on topics of interest.✅ Choice of three Cover Sheets if compiling student su
Subjects:
Grades:
3rd - 6th
Types:
CCSS:
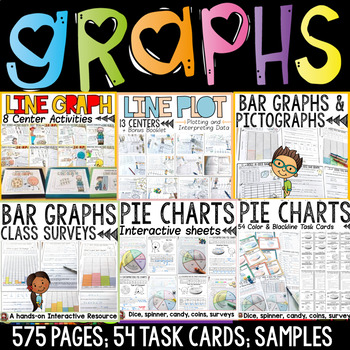
Bar Graphs Pictographs Line Graphs Line Plots Pie Charts Data Collection Bundle
The graphing bundle features interactive activities for creating and interpreting bar graphs, pictographs, line graphs, line plots and pie charts. Your entire graphing unit for a year!Separate folders featuring both British English and US spellings and terminology included.Great quality and value for this whopping 575 + page unit on graphing! Data is collected and interpreted using concrete materials such as visuals, dice, spinners, coins and other real-life objects and contexts. Further details
Subjects:
Grades:
2nd - 6th
Types:
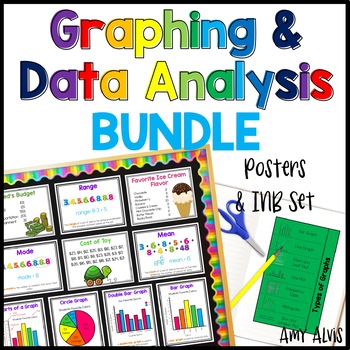
Graphing and Data Analysis Bundle Posters Interactive Notebook INB Anchor Chart
This bundle includes my Graphing Poster and Interactive Notebook (INB) set, my Data Analysis Poster and Interactive Notebook (INB) set and my Data Posters and Cards. Make sure to check the links below to see what comes with each set.This bundle includes:1. My best selling Graphing - Poster and INB Set.This poster and interactive notebook (INB) set includes FOURTEEN posters covering bar graphs, double bar graph, pictographs, picture graph, line graphs, double line graph, line plot, circle graphs
Subjects:
Grades:
2nd - 6th

Bar Graphs Whodunnit Activity - Printable & Digital Game Options
Nothing like a good criminal investigation to liven up bar graphs! Based off my popular CSI projects, I have created Whodunnits? The Whodunnits plan to focus on single content topics as opposed to units and will focus more on skill building than application. Every day can't be a project day, so Whodunnits can be an engaging out of their seat activity to practice important skills. In a Whodunnit?, students will work in teams to solve 10 practice problems that increase in difficult. After each ans
Subjects:
Grades:
3rd - 8th
Types:
CCSS:
Also included in: Pre-Algebra Whodunnit Activity Bundle - Printable & Digital Game Options
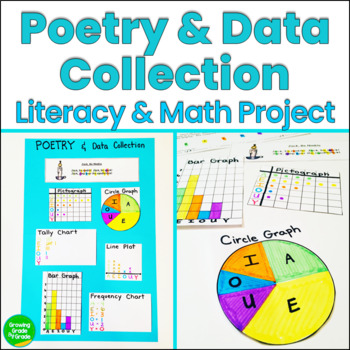
Graphing and Data Project
Kids will have a blast integrating literacy, data, and graphing by using "real-life" data! Students will also enjoy various poems and nursery rhymes while they practice collecting and displaying the number of vowels used in a poem. Poems are included!Kids read a short poem, count all the vowels, then display them on different graphs and charts. Sample images are included. Poems are included as well as suggestions for other great poems. The project is extended with questions for discussion and/or
Subjects:
Grades:
4th - 6th
Types:
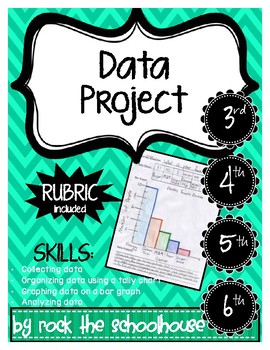
Collect, Organize, Graph, and Analyze Data Project
Includes the WHOLE process:
Generate a survey question to collect data
Record survey results in an organized tally chart
Graph data on a bar graph
Analyze data (observations & inferences) in a written paragraph
Many uses:
Homework
Formative Assessment
Summative Assessment
Review
Differentiated Assignment
Includes:
Student-friendly Directions
Data Recording Sheet
Rubric
Subjects:
Grades:
3rd - 6th
Types:
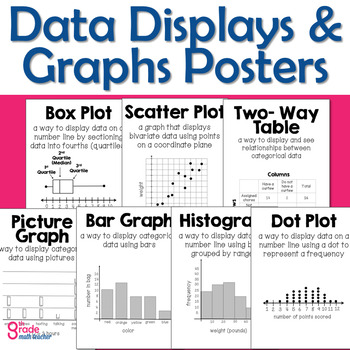
Types of Graphs and Data Displays Posters
Need visuals for your statistics unit? These 7 printable posters show definitions and examples for students of vocabulary they can reference as they learn. They are simple, easy to read, and informative. It's math classroom décor with an important purpose!Hang these posters as part of your word wall all year or when you teach your statistics unit. They are the perfect visual aids and have information students need.Make them colorful! The posters are black and white and can be printed on any colo
Subjects:
Grades:
3rd - 8th
Types:
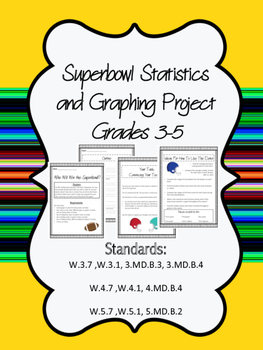
Superbowl Statistics, Graphing Project with Writing Prompt 3-5
****NEWLY UPDATED*****
This project has students selecting a team that will win the Superbowl, then using statistics from the season and graphing to PROVE their team will win. The document lists requirements, types of graphs and ideas for ways to show data with the team's season statistics. Teachers/students will need to go to the NFL website and research the statistics. Teachers could also print these off for teams to use.
The second half of the project has been added in support of CCSS. Stude
Data Analysis Game - Small Group TableTop Practice Activity
Bring the TableTop Game revolution to your classroom! Board games are experiencing a renaissance and tapping into their innate engagement is a no brainer. This is the natural evolution of task cards. TableTop Math games cover a single unit of math study. The questions range from simple skill practice to application. Provided are four different game styles that can be played with the same set of math cards. Mix it up or let your students choose what to play. The choice is yours! In Journey, stude
Subjects:
Grades:
6th - 10th
Types:

Bar Graphs Activity - Printable & Digital Bulgaria Adventure Worksheet
A play on the Adventure books of your childhood with bar graphs. An Adventure assignment allows students choice of which problems they practice. After each problem they receive a clue about the mystery country they are exploring. By the end, hopefully they will have enough pieces of the puzzle to guess where in the heck they are. Student choices will affect the types of clues they will receive and allows for additional practice for enrichment or remediation. In my experience, our students are un
Subjects:
Grades:
4th - 7th
Types:
CCSS:
Also included in: Adventure - PRE-ALGEBRA BUNDLE - Printable & Digital Activities
Bar & Circle Graph Mini Project: Survey, Graph, & Analyze Data
Bar and Circle Graph Mini Project
Texas TEKs 6.12C, 6.12D, 6.12H
A fun way to actively engage students in learning.
Students can be assigned to work individually or in small groups.
Each individual / group randomly selects a project card and follows the directions to complete tally charts, bar graphs, and circle graphs. In most cases students will use rulers to draw their own charts and graphs. However, a prepared worksheet has been provided as a modification for struggling students. I re
Subjects:
Grades:
4th - 8th
Types:

STEM-ersion - Bar Graphs Printable & Digital Activity - Wildlife Ranger
STEM-ersion assignments aim to immerse students in an authentic application within a STEM career. This STEM-ersion focuses on bar graphs. Students often ask what careers will use certain math skills and I think this is an opportunity to show them where the thinking is used! These problems aim to help students construct responses with my Evidence - Analysis - Conclusion framework that I use in all of my classes. These questions are carefully crafted not to have one correct answer, but to require
Subjects:
Grades:
3rd - 8th
Types:
CCSS:
Also included in: STEMersion - PRE-ALGEBRA BUNDLE - Printable & Digital Activities
Probability, Patterns, Graphs, and Equations Mini-unit BUNDLE
Probability and Patterns Worksheets and Study Guide including determining the likelihood of an event, representing probability as a number, creating models or practical problems to represent probability, and patterns found in objects, pictures, numbers, and tables. Correlated with 2016 VA SOL 4.13 and 4.15 and CCSS 4.OA.C.5 and 7.SPC.5. The calculator symbol indicates that the problems in this unit will appear on the section of the Grade 4 Virginia SOL Math test that allows a calculator. I
Subjects:
Grades:
3rd - 7th
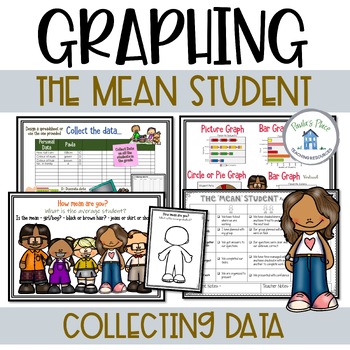
Graphing the Mean | Your Mean Student - Project Based Learning
Graphing the Mean - Your students will experience a math task that will lead to a group presentation. They will compose questions, collect data, collate data, determine the ‘mean’, show the data in various graphs and design a poster to present the ‘mean student’.Slides include-What the unit will cover-How mean are you? What will you be looking for?-What is the mean?-How mean are you?-Template for recording the mean student-Ideas for recording data-Group guidelines – it’s your turn-Types of graph
Subjects:
Grades:
4th - 6th
Creating a Data Display
This project provides students with step-by-step instructions to create a data display in google classroom. Four basic types of graphs are discussed:Bar graphHistogramPie ChartLine GraphThis activity also gives students the opportunity to differentiate between quantitative and qualitative data (although this question could be omitted for younger students.This assignment is a great chance for students to use google sheets in a relevant manner. The skills that students will develop from this activ
Subjects:
Grades:
6th - 12th, Higher Education
Types:
CCSS:

Bar Graphs - - Printable & Digital Activity - Erin Gruwell Person Puzzle
Bring to life the traditional practice class or homework assignment with some global competency and diversity! While your students practice interpreting bar graphs, they can learn about the inspirational teacher Erin Gruwell!Person Puzzles are designed to highlight individuals with diverse backgrounds who have made significant contributions to our world. I typically use Person Puzzles as timed warm-ups which allows me to share a little about the person's background before my daily lesson. I can
Subjects:
Grades:
4th - 8th
Types:
CCSS:
Also included in: Person Puzzles PRE-ALGEBRA BUNDLE - Printable & Digital Activities
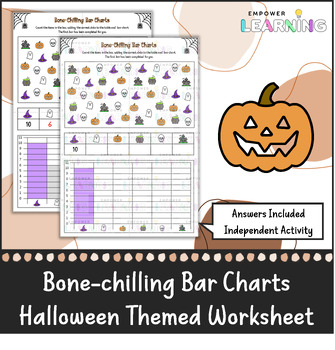
Bone-chilling Bar Charts - Halloween Math Worksheet
Bone-chilling Bar ChartsEngaging Halloween worksheet on bar charts, requiring students to count items, fill in a table and then construct a bar chart using this information. This resource comes with an answer key with completed table and bar chart.
Subjects:
Grades:
3rd - 8th
Array We Go! Introducing Multiplication, Factors, Primes, & Composites
This is an engaging and visual way to introduce multiplication and the concepts of factors, multiples, primes, composites and MORE! Students build arrays for the numbers 1–25 and look for patterns and characteristics that help them learn to recognize multiples. Directed questions also help them to learn to identify primes and composites. Square numbers, factor rich numbers, and perfect numbers are included for more advanced students.
Extensions allow you to take the lesson to a multi-day in dept
Subjects:
Grades:
3rd - 6th
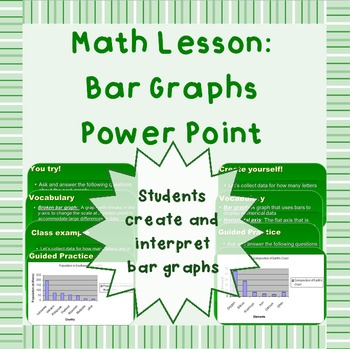
Bar graphs - Power Point presentation
This .ppt presentation is perfect for teachers who have students needing a refresher on bar graphs. It reviews the terminology of bar graphs (including broken bar graphs) and has students collect data in class and create a bar graph.
This is NOT a unit, assessment, or homework assignment.
This is in PPT Show format.
Other statistics PowerPoint lessons you may find useful:
Finding Mean Median Mode and Range Power Point Lesson
Basic standard deviation and distribution curves and statisti
Subjects:
Grades:
3rd - 7th
CCSS:
STEM-ersion - Pictographs Printable & Digital Activity - Cafeteria Manager
STEM-ersion assignments aim to immerse students in an authentic application within a STEM career. This STEM-ersion focuses on pictographs. Students often ask what careers will use certain math skills and I think this is an opportunity to show them where the thinking is used! These problems aim to help students construct responses with my Evidence - Analysis - Conclusion framework that I use in all of my classes. These questions are carefully crafted not to have one correct answer, but to require
Subjects:
Grades:
3rd - 12th
Types:
CCSS:
Also included in: STEMersion - PRE-ALGEBRA BUNDLE - Printable & Digital Activities
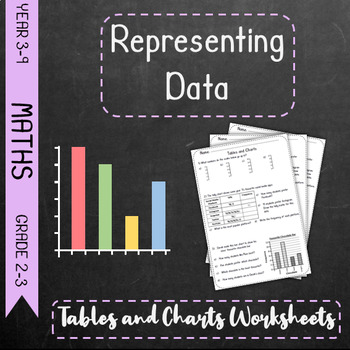
Representing Data - Charts and Tables Worksheets
This resource consists of differentiated worksheets. The worksheets are a set of 3 differentiations with some overlap in both PDF and PowerPoint form for easy editing. There is also an undifferentiated exit card for assessment purposes. This is a PDF.These worksheets are part of a full lesson available here
Subjects:
Grades:
2nd - 9th
Types:
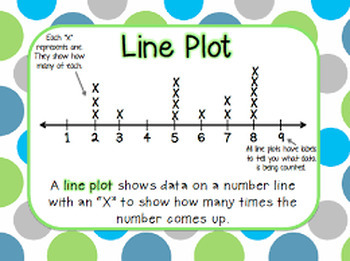
Interpreting Line Plots Google Form
I created this google form to check for understanding of how my students interpreted a line plot.
Subjects:
Grades:
4th - 6th
Types:
CCSS:

Fidget Spinner Data and Probability
Fidget spinner data and Probability math project
Subjects:
Grades:
2nd - 6th
Types:
CCSS:
Showing 1-24 of 27 results


