10 results
6th grade earth sciences Common Core 3.MD.B.3 resources
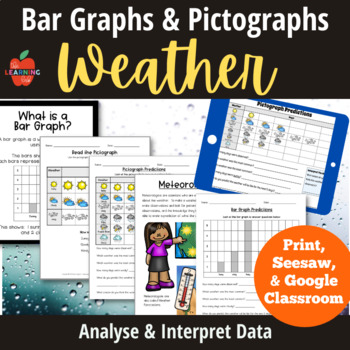
Weather NGSS ESS2: pictographs, bar graphs, forecasting, predictions, posters
Weather Bar Graphs and Pictographs for observing, analyzing and interpreting data! This package is both printable and digital (for Seesaw AND Google Classroom.) NGSS ESS2: Earth's Systems. Look at typical weather patterns, use data to make predictions, and consider connections to seasons!Printable 30 pages* Weather Forecast Worksheets (3 versions) *What is a Pictograph definition (2 versions) *Read the Pictographs worksheets *Meteorologist Fact Sheet (also with practice pictograph) *Pictograph P
Subjects:
Grades:
2nd - 6th
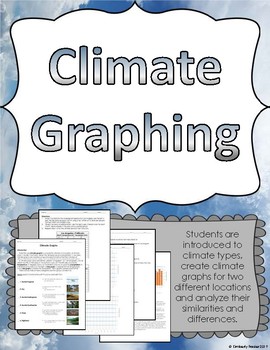
Climate Graphing Activity
Help students understand the basics of climate through this graphing activity. Not only does this address the science standards, it also integrates math and data analysis.Included in this printable graphing activity:-Introduction to what climate graphs are-Descriptions of 6 major types of climates-Directions for how to make a climate graph-Climate graph set ups-Data for two locations: New York City and Los Angeles-Analysis questions comparing the two climate graphs (use of CER)-Set of climate gr
Subjects:
Grades:
3rd - 9th
Types:
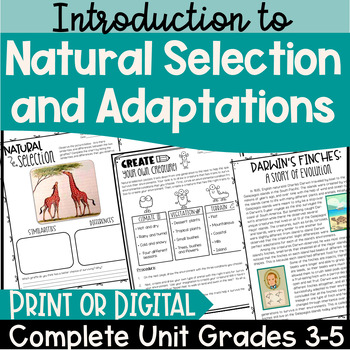
Natural Selection and Adaptations: Complete Unit with Reading Passages
A highly engaging NGSS aligned unit covering natural selection and adaptations. Students will enjoy the interesting reading passages based on scientific phenomena that are given as a central theme to each lesson. Reading comprehension questions are aligned with ELA standards. Also included are several fun, engaging activities that students will enjoy while gaining a deeper understanding of the content. Students sharpen their math skills by graphing data and analyzing results. Students also u
Subjects:
Grades:
3rd - 6th
Types:
NGSS:
3-LS4-3
, 3-LS4-2
, 3-LS4-4
Also included in: 3rd and 4th Grade Science Bundle (NGSS Aligned)
World Weather and Climate Stations Analysis and Graphing for Science and Math
Set up these 6 stations to encourage students to develop their graph-reading skills and help students recognize differences between weather and climate. Simple to use in math or science lessons. Just print, cut, and tape! For today's weather, please visit Accuweather.In this PacketPg 2 Preview Washington DC Fahrenheit (together as a class, one per student)Pg 3-4 Student Handout (print double sided, one per student)Pg 5 Buenos Aires/Cairo Fahrenheit (cut in two and tape one per station)Pg 6
Subjects:
Grades:
3rd - 6th
Types:
NGSS:
3-ESS2-1
, 3-ESS2-2
Also included in: World-focused Science and Math Activities for Upper Elementary
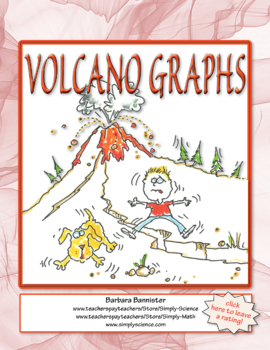
Graph Northwest Volcanoes Based on Location or Height
Quick and easy, just what you need to integrate science and math.Graph volcanoes based on location or height. Graph in meters or feet. Use prepared graphs or graph paper. I included my ten rules for graphing that you can format for your classroom using a Word™ file. I also included completed graphs so you'll have an answer key and students can compare their work to a completed graph.Thanks for visiting my Simply Science store. Please take a moment to leave a comment when you purchase a product.M
Subjects:
Grades:
3rd - 7th
Types:
CCSS:
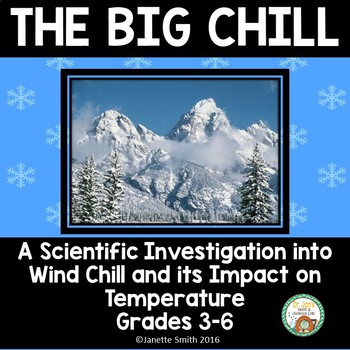
Temperature and Wind Chill: An Integrated Weather Activity
This engaging cooperative activity includes simulating a real life scenario to investigate the impact of wind and water on temperature. Math activities such as thermometer reading practice and making bar graphs are integrated within this activity.
Aligned to Next Generation and Common Core Standards.
Appropriate for grades 3-6.
Please leave feedback and earn TpT credits for future purchases.
If you like this download, you might also like these similar products:
Photosynthesis
Atomic Struc
Subjects:
Grades:
3rd - 6th
Types:
Also included in: Weather Super Bundle
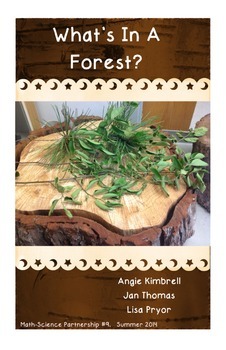
Layers of a Forest Big Book Non-Fiction Text
You've found a great non-fiction resource about forest layers. NOTE:**This is not a Rain Forest Book!** Very few teacher resources talk just about forests that are in North America, let alone Oklahoma!! This big book is 11x17 in size and full color with actual photography taken from forests in Oklahoma. While teaching about the layers of the forest, there are math comprehension questions along the way, graphs, maps, and diagrams to read that are all related to forests! There are lots of non-
Subjects:
Grades:
K - 7th
Types:
STEM Activity on Weather & Graph Worksheet
The Annual Precipitation Challenge is a hands-on approach to teaching about your local climate and annual precipitation patterns for grades 3-6. After completing this activity, students will be able to graphically display and interpret a city's annual precipitation, and estimate a location's monthly precipitation using water in 12 cups. Your curriculum is incomplete without this Earth Sciences activity!The annual precipitation is the total amount of precipitation (primarily rain and snow) that f
Subjects:
Grades:
3rd - 6th
Types:
NGSS:
3-ESS2-1
Excel Graphing Temperature Comparison
What's the temperature like in YOUR town? Does your curriculum include a study of weather factors? This Temperature Comparison Excel double-bar graph project can be an engagingway to:* integrate technology, math, science, and geography* introduce, extend, or enrich a math, social studies, or science topic of study* introduce or practice creating sheets and charts using Excel* give students a chance to make connections across the content areasThis classroom-tested project file includes: * student
Grades:
4th - 6th
Types:
NGSS:
5-ESS1-2
, 3-ESS2-1
, 3-ESS2-2
, 5-ESS2-1
, MS-ESS2-6
...
Rovers Presentation with Activity
Humans have dreamed of visiting Mars since the 1880s, but getting there isn’t easy. Using a game board modeled after the orbits of Mars and Earth, student teams will plot a course to Mars and back. As they plan their Mars mission, students will use the same navigation method that NASA uses for interplanetary travel - the Hohmann Transfer Orbit. You can use this STEM activity and the Rovers slideshow to introduce a Solar System unit or a Mars rover design project. In addition to planning their v
Subjects:
Grades:
3rd - 6th
NGSS:
3-PS2-2
, 4-PS3-1
, 5-PS2-1
Showing 1-10 of 10 results

