Living and Nonliving Things Science Vocabulary Bingo Activity
- Word Document File
Description
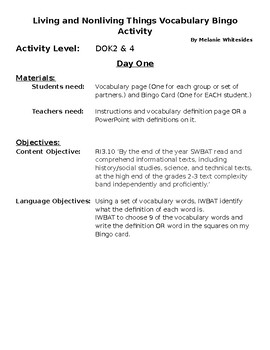
This is a Science Activity Lesson based on the Science Standard about Living and Nonliving Things. It also ties in with Math Standards regarding creating and reading bar graphs and number lines. While that standard pertains to 3rd grade many other grades need to review and reteach it to help students. This activity helps ESL students and others to master the vocabulary for the science standard as well. This activity is a DOK level 2 and 4 but is not complicated.
It will take 3 days and all papers needed are included. On day one students work in groups to identify the definitions of the vocabulary words and then use them to create a Bingo Card. On day two students play the Bingo Game. On day three, data collected during day one and day two is used to create bar graphs and number lines. Students then write number sentences and answer questions about the data. At the end of this lesson students will understand how to read a bar graph and a number line, how to write number sentences to answer questions, and what the kid friendly definitions are for the vocabulary used in living and nonliving things.
My name is Melanie Whitesides and I have several lessons for science and math based on problem solving. I strongly believe in giving students higher level thinking activities based on DOK2, 3, and 4. This helps them master the curriculum and prepares them for the real world. Math and science are subjects that many students begin to give up on if not approached the right way.
Living and Nonliving Things Vocabulary Bingo Activity by Melanie Whitesides is licensed under a Creative Commons Attribution-NonCommercial 4.0 International License.


