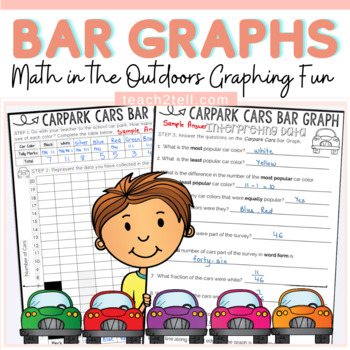
Bar Graphs Worksheets Collecting and Interpreting Data and Graphing Activity
- Zip
What educators are saying
Also included in
- Are you looking for a comprehensive Math Curriculum bundle that includes a variety of resources and activities that cover 4th Grade, 5th Grade, and 6th Level standards?This Math Curriculum Bundle has a range of print and digital resources to teach and reinforce key math concepts aligned to the stanPrice $58.50Original Price $116.10Save $57.60
Description
Need a fun bar graphing and data collection activity? These free bar graph worksheets will get your students out of the four walls of the classroom and into the outdoors.
Students will graph the car colors in the Staff Car Park. They will have the opportunity to use tally marks to collect data to construct a bar graph.
A set of questions also require students to interpret the constructed bar graph. Not only will learning be more realistic but it will also be a welcome change, perhaps from the daily routine.
Separate files featuring both British English and US spellings and terminology included.
Also Included In
Related Resources
- Chance and Probability Bundle
- Budgeting Plans and Graphing
- Fractions Bundle
- Subitizing Number Sense Building
- Place Value Bundle
- Mental Multiplication Strategies
Thank you for visiting Teach2Tell. New resources are 50% off - do follow the store to get notified :)
Please contact me with any queries regarding this resource.
Thank you!
Laurane@teach2tell.com


