13 results
6th grade instructional technology Common Core 3.MD.B.3 resources
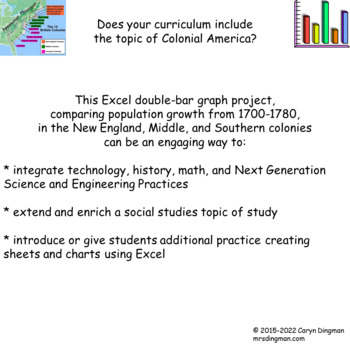
Excel Graphing 13 Colonies Population Growth with Digital Student Directions
Does your curriculum include a study of Colonial America? This Excel double-bar graph project, comparing population growth from 1700-1780, in the New England, Middle, and Southern colonies, can be an engaging way to:* integrate technology, history, math, and Next Generation Science and Engineering Practices* extend and enrich a Social Studies unit of study* introduce or practice having students create sheets and charts using ExcelProject file includes:* teacher notes/ classroom management sugges
Grades:
4th - 6th
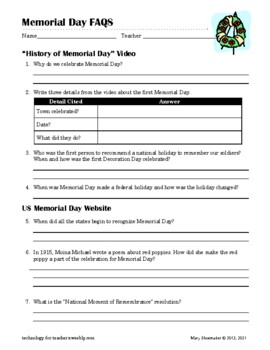
Memorial Day: Internet Research
There are many Americans who have served in the armed forces and lost their lives. This product is a worksheet to complement your social studies/history curriculum for your students to complete as they use the internet to research and learn more about Memorial Day. Students will watch a short video about Memorial Day and read to find answer to other questions. Students also create a bar graph using information provided on the website. The websites that are used for this worksheet is given along
Grades:
3rd - 6th
Types:
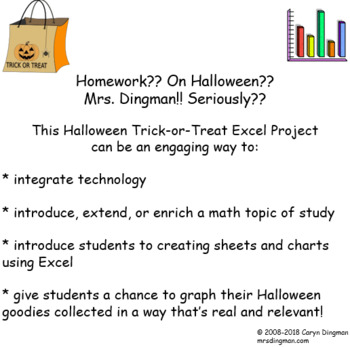
Excel Graphing Halloween Trick-or-Treat
Homework?? On Halloween?? Seriously??!!This Halloween Trick-or-Treat Excel Project, updated July 2018, can be an engaging way to:* integrate technology* introduce, extend, or enrich a math topic of study* introduce students to creating sheets and charts using Excel* give students a chance to graph their Halloween goodies collected in a way that’s real and relevant! This classroom-tested Halloween Excel project file includes: * student project directions sheet, in checklist form * rubric to score
Subjects:
Grades:
3rd - 6th
Types:
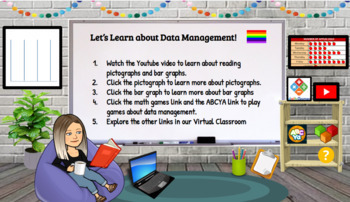
Data Management Bitmoji Virtual Classroom
This Bitmoji Virtual Classroom is focused on Data Management. It is suitable for elementary students. Simply remove my Bitmoji and add yours to create a personal touch. The slides include instructions, links to videos, websites, and games. There is a vocabulary slide included as well as an assignment. It is fully editable for your own needs. Enjoy!
Subjects:
Grades:
3rd - 6th
Types:
CCSS:
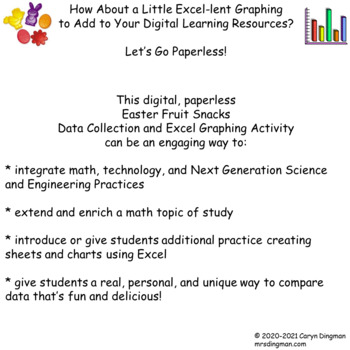
Excel Graphing Easter Fruit Snacks with Digital Student Directions
How About a Little Excel-lent Graphing to Add to Your Digital Learning Resources?Let’s Go Paperless!This digital, paperless Easter Fruit Snacks Data Collection and Excel Graphing Activitycan be an engaging way to:* integrate math, technology, and Next Generation Science and Engineering Practices* extend and enrich a math topic of study* introduce or give students additional practice creating sheets and charts using Excel* give students a real, personal, and unique way to compare data that’s fun

Excel Graphing Planet Weights with Digital Student Directions
Does your curriculum include a study of the solar system and/or forces and motion?Want to give your students a real-world and personal way to practice decimal multiplication?This Planet Weights Excel Project can be an engaging way to:* integrate technology, math, and Next Generation Science and Engineering Practices* introduce, extend, or enrich a math and science topic of study* introduce or practice creating sheets and charts using Excel* give students a chance to make connections across the c
Subjects:
Grades:
3rd - 6th
Types:
NGSS:
5-ESS1-2
, MS-PS2-4
Valentine Candy Hearts Google Sheets Graphing with Digital Student Directions
How About a Google Sheets Graphing Activity to Add to Your Digital Learning Resources?This digital, paperless Valentine Candy Hearts Data Collection and Google Sheets Graphing Activity can be an engaging way to:* integrate math, technology, and Next Generation Science and Engineering Practices* extend and enrich a math topic of study* introduce or give students additional practice creating sheets and charts using Google Sheets* give students a real, personal, and unique way to compare data that’
Grades:
3rd - 6th
Excel Graphing Halloween Fruit Snacks with Digital Student Directions
How About a Little Excel-lent Graphing to Add to Your Digital Learning Resources?This digital, paperless Halloween Fruit Snacks Data Collection and Excel Graphing Activity can be an engaging way to:* integrate math, technology, and Next Generation Science and Engineering Practices* extend and enrich a math topic of study* introduce or give students additional practice creating sheets and charts using Excel* give students a real, personal, and unique way to compare data that’s fun and delicious!
Subjects:
Grades:
3rd - 6th
Types:
Excel Graphing Temperature Comparison
What's the temperature like in YOUR town? Does your curriculum include a study of weather factors? This Temperature Comparison Excel double-bar graph project can be an engagingway to:* integrate technology, math, science, and geography* introduce, extend, or enrich a math, social studies, or science topic of study* introduce or practice creating sheets and charts using Excel* give students a chance to make connections across the content areasThis classroom-tested project file includes: * student
Grades:
4th - 6th
Types:
NGSS:
5-ESS1-2
, 3-ESS2-1
, 3-ESS2-2
, 5-ESS2-1
, MS-ESS2-6
...
Excel Graphing Lucky Charms Marshmallows
Give your students a real-world chance to compare Lucky Charms cereal marshmallow data in a way that's personal and unique!This Lucky Charms Marshmallows Excel Project can be an engaging way to:* integrate technology* introduce, extend, or enrich a math topic of study* introduce or give students additional practice creating sheets and charts using Excel The classroom-tested product file includes:* student project directions sheet, in checklist form* rubric to score each completed graph* sample b
Grades:
3rd - 6th
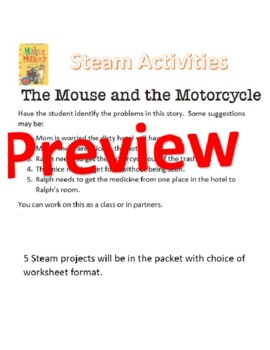
Steam Projects for The Mouse and the Motorcycle
I have created a packet of 7 different STEAM projects to complete. You can brainstorm as a class the problems from the story. Then allow the students to choose what problem they would like to design and create a solution for. You may alos choose to do the same problem and solution as a class. The choice is yours. Please let me know if you would like anything added or changed. I am here to help. IncludedProblems in the book7 STEAM projects Science notebook flapsWorksheets to fill out for t
Subjects:
Grades:
3rd - 7th
Types:
NGSS:
MS-ETS1-2
, 3-5-ETS1-3
, MS-ETS1-4
, 3-5-ETS1-1
, MS-ETS1-1
...
Excel Graphing Pulse Rate Comparison
Does your curriculum include a study of the circulatory system? This Pulse Comparison Excel double-bar graph project can be an engaging way to:* integrate technology, math, and science* introduce, extend, or enrich a math or science topic of study* introduce or practice creating sheets and charts using Excel* give students a chance to make connections across the content areasStudents will be encouraged to wonder… Would the time of day and what we were doing affect our pulse rates?Pulses will be
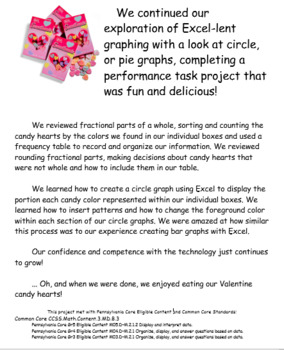
Excel Graphing Valentine Conversation Hearts
Explore Excel circle graphing with a Valentine's Day project that's fun and delicious!Students will create circle, or pie graphs using Excel to display Valentine candy hearts' data. Fractional parts of a whole will be reviewed and discussed as part of the project. Project file includes sample bulletin board display poster, project directions in individual student checklist form, and rubric to grade the finished graph.Project file student directions have been updated for Excel 2016.This project w
Grades:
3rd - 6th
Showing 1-13 of 13 results

