TPT
Total:
$0.00

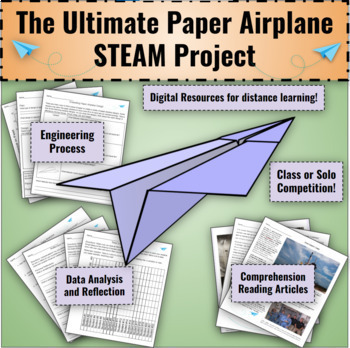
The Ultimate Paper Airplane STEAM Project: 10 Day Engineering Design Challenge

Rated 4.86 out of 5, based on 7 reviews
4.9 (7 ratings)
;
Grade Levels
3rd - 8th
Resource Type
Standards
Formats Included
  • Google Drive™ folder
Pages
36 pages
$10.00
$10.00
Share this resource
Report this resource to TPT
Made for Google Drive™
This resource can be used by students on Google Drive or Google Classroom. To access this resource, you’ll need to allow TPT to add it to your Google Drive. See our FAQ and Privacy Policy for more information.

What educators are saying

This is great project-based learning and can be used with many math skills and standards. I love the reflection components.
This was a good resource! I had to adjust it slightly to work for my class but it was a great starting point.

Description

Every year since I started teaching, I've done a paper airplane contest. When I first started around 10 years ago, it was a quick contest that lasted just a few minutes. Gradually, as my experience as an educator grew, this project began to grow into what it is today... A 10 day cross-curricular mega project! I always say that student engagement is the key to learning, and I can almost guarantee that your students will be engaged during these activities! They will be measuring, graphing, reading, analyzing data, and going through the engineering design process. They will be using all the components of STEAM(Science, Technology, Engineering, Art, Math) during this project and will have a blast doing it!

I have been working on perfecting this project for about 10 years now, and I want to share it with you! I've had over 50 downloads of this project, and the number keeps growing! Join the fun and please leave a review :) NOW INCLUDES A FREE VIRTUAL ESCAPE ROOM!

PLEASE CONSIDER: Visit my other store to see more activities!

Total Pages
36 pages
Answer Key
N/A
Teaching Duration
2 Weeks
Report this resource to TPT
Reported resources will be reviewed by our team. Report this resource to let us know if this resource violates TPT’s content guidelines.

Standards

to see state-specific standards (only available in the US).
Draw a scaled picture graph and a scaled bar graph to represent a data set with several categories. Solve one- and two-step “how many more” and “how many less” problems using information presented in scaled bar graphs. For example, draw a bar graph in which each square in the bar graph might represent 5 pets.
Generate measurement data by measuring lengths using rulers marked with halves and fourths of an inch. Show the data by making a line plot, where the horizontal scale is marked off in appropriate units-whole numbers, halves, or quarters.
Know relative sizes of measurement units within one system of units including km, m, cm; kg, g; lb, oz.; l, ml; hr, min, sec. Within a single system of measurement, express measurements in a larger unit in terms of a smaller unit. Record measurement equivalents in a two-column table. For example, know that 1 ft is 12 times as long as 1 in. Express the length of a 4 ft snake as 48 in. Generate a conversion table for feet and inches listing the number pairs (1, 12), (2, 24), (3, 36),...
Use the four operations to solve word problems involving distances, intervals of time, liquid volumes, masses of objects, and money, including problems involving simple fractions or decimals, and problems that require expressing measurements given in a larger unit in terms of a smaller unit. Represent measurement quantities using diagrams such as number line diagrams that feature a measurement scale.
Make a line plot to display a data set of measurements in fractions of a unit (1/2, 1/4, 1/8). Solve problems involving addition and subtraction of fractions by using information presented in line plots. For example, from a line plot find and interpret the difference in length between the longest and shortest specimens in an insect collection.

Reviews

Questions & Answers