241 results
6th grade Common Core 3.MD.B.3 resources under $5
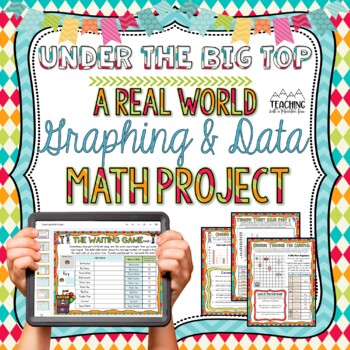
Graphing and Data Math Project
Your students will love working on this digital and printable 12-page graphing and data math project with a fun and engaging carnival theme! They will interpret data tables and graphs as well as create their own data tables and graphs. Each page also includes tasks and questions about each graph!The pages stand alone, so you can use a few of the pages or all of them depending on how much time you have and the skills your students are ready to review. (Making them PERFECT for DIFFERENTIATION!)W
Subjects:
Grades:
3rd - 6th
Types:
Also included in: Math Projects BUNDLE | Real-World Activities for Math Skills
4th grade Project Based Learning Projects 5th Grade
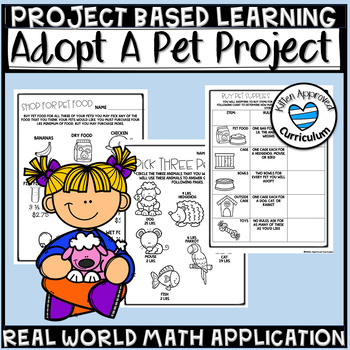
Students will love picking out their own pet using real-world math applications in this PBL - adopting pets, feeding and training them, buying pet supplies, and more! Incorporate authentic real-world problems into your classroom using this engaging activity. This product is differentiated, with multiple versions of some pages created to range in difficulty. Choose between multiple options including multiplication of whole numbers, fractions, and decimals to best suit your classroom's needs. Not
Subjects:
Grades:
3rd - 6th
Types:
Also included in: Project Based Learning Bundle Math Enrichment Gifted Student Activities
Bar Graphs Worksheets & Bar Graphs Activities Pictographs Picture Graphs
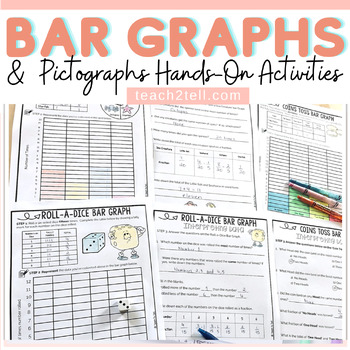
This collection of interactive worksheets feature interpreting data in bar graphs and pictographs. Data is collected using concrete materials such as visuals, dice, spinners, coins and M&M’s. This data is then represented in bar graphs and interpreted. The section on pictographs requires collected data to be interpreted.US and British English spellings and terminology files included.These no-prep printables facilitate students to move from the concrete to the abstract. Graphs target students
Subjects:
Grades:
3rd - 6th
Types:
CCSS:
Data and Graphing Project - Real World Math Project Based Learning Activities
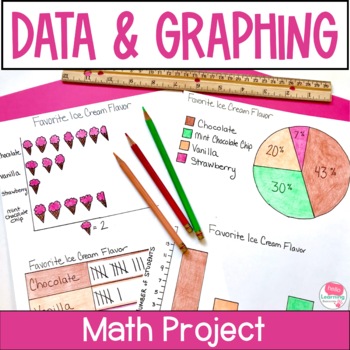
This data and graphing project gives your students a meaningful way to apply their data and graphing skills. Use this real world math project as an end of unit activity, enrichment activity or assessment. Easy to use and fun for students!Click the PREVIEW button above to see everything that is included in this fun math project!⭐ This resource includes:teacher information, directions and sample schedulesupply listgrading rubricstudent direction sheettwo data collection sheets (one for open ended
Subjects:
Grades:
4th - 6th
Types:
CCSS:
Types of Graphs Anchor Chart - Tally Chart, Bar Graph, Pictograph, Line Plot
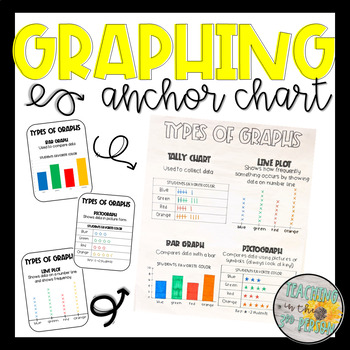
Graphing made easy!Use these templates as a guide in creating your own anchor charts or print and use them in other helpful ways:Trace and create an anchor chart with studentsPrint on bright colored paper and use as postersShrink down and glue in student' math notebooks for a reference sheetPrint and send home as reference tools for students and parents (homework or tutoring)Earn Credit for Future Purchases:I appreciate each & every word of your valuable feedback. Also, if you leave feedback
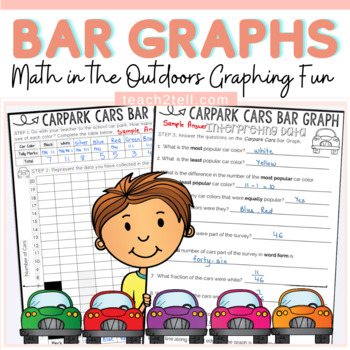
Bar Graphs Worksheets Collecting and Interpreting Data and Graphing Activity
Need a fun bar graphing and data collection activity? These free bar graph worksheets will get your students out of the four walls of the classroom and into the outdoors. Students will graph the car colors in the Staff Car Park. They will have the opportunity to use tally marks to collect data to construct a bar graph. A set of questions also require students to interpret the constructed bar graph. Not only will learning be more realistic but it will also be a welcome change, perhaps from the da
Subjects:
Grades:
2nd - 6th
Types:
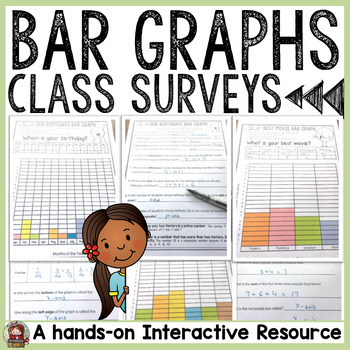
BAR GRAPHS: CLASS SURVEYS ACTIVITIES
BAR GRAPHS: SURVEYSThis Bar Graphs Class Surveys collection features collecting, graphing and interpreting data on topics your students will relate to. This is perfect for a getting-to-know-you back to school activity, or alternatively for applying graphing skills in real life situations.⭐ Separate folders featuring both British English and American spellings and terminology included.►What’s Included✅ 12 Class Surveys on topics of interest.✅ Choice of three Cover Sheets if compiling student su
Subjects:
Grades:
3rd - 6th
Types:
CCSS:
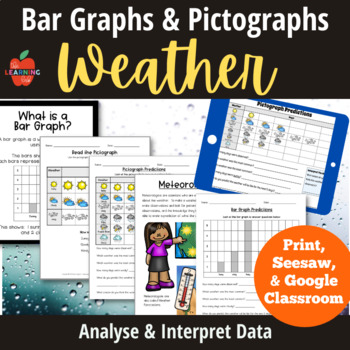
Weather NGSS ESS2: pictographs, bar graphs, forecasting, predictions, posters
Weather Bar Graphs and Pictographs for observing, analyzing and interpreting data! This package is both printable and digital (for Seesaw AND Google Classroom.) NGSS ESS2: Earth's Systems. Look at typical weather patterns, use data to make predictions, and consider connections to seasons!Printable 30 pages* Weather Forecast Worksheets (3 versions) *What is a Pictograph definition (2 versions) *Read the Pictographs worksheets *Meteorologist Fact Sheet (also with practice pictograph) *Pictograph P
Subjects:
Grades:
2nd - 6th
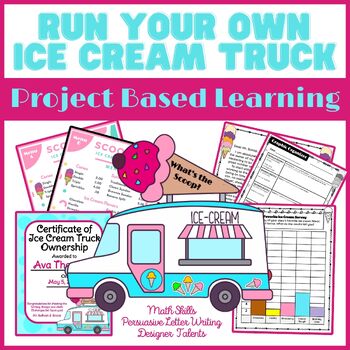
Summer Fun End of Year ELA & Math Project Based Learning Unit 3rd 4th 5th Grade
This Summer Fun or End of Year ELA & Math Project, Run an Ice Cream Truck is a Project Based Learning Unit for 3rd, 4th & 5th Grade & involves Real World Math Worksheets, Persuasive Letter Writing with Graphic Organizers, Rubric and anchor charts. Perfect for Literacy and Math Centers! Digital & Print Options Available This is a guaranteed winner!!!!See Preview for a more detailed description!Mr. Sullivan I. Scoops is giving away 25 ice cream trucks but students must prove tha
Subjects:
Grades:
3rd - 6th
Types:
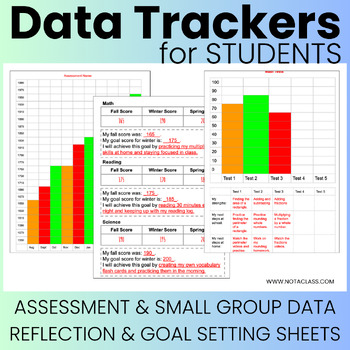
Student Assessment Data Trackers, Collection, & Goal Setting Sheets for Folders
These assessment data trackers and goal setting sheets are perfect for your student data folders and data collection for various tests in reading, math, and science. All the pages are fully editable, allowing you to adjust them based on your students' needs, scores, and assessments. You can place these in individual data folders for all your students or have them create these folders themselves. Consider color-coding the data trackers based on different grade levels, subjects, and periods. For e
Grades:
1st - 12th, Higher Education, Adult Education, Staff
Types:
Also included in: Data Trackers for Students and Teachers - Bundle | Editable
Understanding Graphs PowerPoint Lesson
Types of Graphs at the Movies
This 37-slide PowerPoint Presentation will give your students the tools they need to learn about bar graphs, double-bar graphs, line graphs, and pie charts. Students will review necessary graph vocabulary, walk through guided practice of each type (using strategies to understand what each question is asking), and complete the lesson with test prep style questions to determine mastery of the standard.
The theme of the PowerPoint is “Graphs at the Movies”, so s
Subjects:
Grades:
3rd - 6th
CCSS:
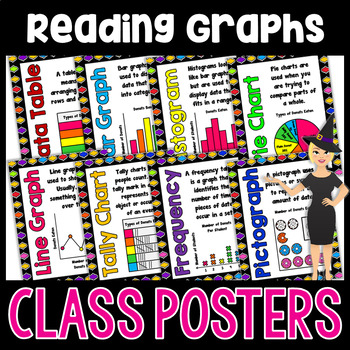
Types of Graphs Posters
Looking for simple but effective visuals for types of graphs? This poster set will look great in your classroom and give students a quick reference guide for selecting the appropriate type of graph for their data.Included:✔ One multi-color set with black background. ✔ One multi-color set with white background. Each set includes a poster for Data Chart, Bar Graph, Histogram, Pie Chart, Line Graph, Tally Chart, Frequency Table, & Pictograph.Each poster includes a description of when each graph
Subjects:
Grades:
3rd - 6th
Types:
Also included in: Reading and Interpreting Graphs Activities Bundle

Bar Graphs Whodunnit Activity - Printable & Digital Game Options
Nothing like a good criminal investigation to liven up bar graphs! Based off my popular CSI projects, I have created Whodunnits? The Whodunnits plan to focus on single content topics as opposed to units and will focus more on skill building than application. Every day can't be a project day, so Whodunnits can be an engaging out of their seat activity to practice important skills. In a Whodunnit?, students will work in teams to solve 10 practice problems that increase in difficult. After each ans
Subjects:
Grades:
3rd - 8th
Types:
CCSS:
Also included in: Pre-Algebra Whodunnit Activity Bundle - Printable & Digital Game Options
STEM: Fall Halloween - Candy Corn Tower - Engineering, Integrated Math & Writing
STEM: Fall Halloween - Candy Corn Tower - Engineering, Integrated Math & WritingYour team has been given a challenge! Build the tallest FREE-STANDING structure you can with 25 candy corns and 25 toothpicks. Walk through the ENGINEERING DESIGN PROCESS and utilize INTEGRATED MATH & WRITING. Ask, Imagine, Plan, Build, Improve, and HAVE FUN!Materials: Only 25 candy corns and 25 toothpicks needed for each team (not included). REMEMBER TO LEAVE ME RATINGS & FEEDBACK : )We love hearing from
Bar Graph Worksheets
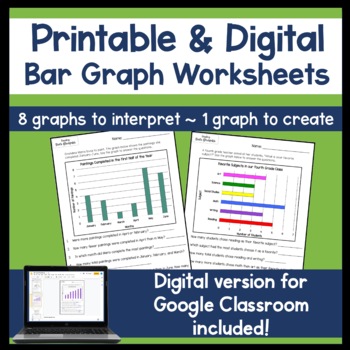
This interpreting graph resource includes eight worksheets with bar graphs followed by questions about the graph. It also includes one worksheet for students to create a graph with data given. A printable PDF option and a digital option for Google Classroom are both included.8 graphs to interpret and 1 graph to create5 bar graphs have vertical bars3 bar graphs have horizontal bars6 graphs have categorial data2 graphs have numerical dataThese would be best for upper elementary.Answer keys are inc
Grades:
3rd - 6th
Types:
Also included in: Bar Graph Mini- Bundle
Measurement Galore - Reading a Tape Measure
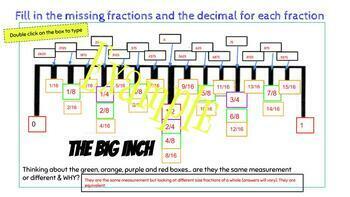
This product come from struggling to teach students how to use the measuring tape and how to understand the fractions on a measuring tape. It has multiple representations of reading fractions on a measuring tape and fraction bar. It has spaces to type in answers and printable test pages to assess learning. It shows multiple ways to represent the same fraction (equivalent fractions). It is fun, yet rigorous. I included websites where your students can go to play online measurement games and vi
Grades:
3rd - 12th, Higher Education, Adult Education
Types:
Science Fair Project Organizational Tools
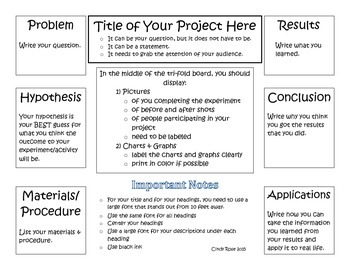
Science Fair time means lot of questions from parents and students! These tools I've created will help to put you, your students, and your parents at ease by showing how to organize a successful science fair project! You will be able to use these handouts year after year!!
You will get a four page handout to give your students/parents that gives detailed page by page directions on how to organize the project notebook. The project notebook explains how to set up the report which includes the
Subjects:
Grades:
3rd - 6th
Types:
Graphs & Survey Templates - Conduct a Survey, Create Graphs, Analyze Data
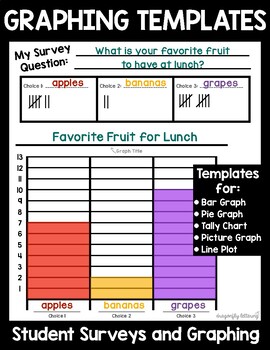
Graphing and Survey TemplatesAligns with K-5 CCSS for Measurement and DataThese worksheets can be used YEAR ROUND! Students love giving surveys and gathering information from their classmates. Graphing and analyzing data is an important skill that develops across grade levels.This file includes:2 Introductory Bar Graph Surveys4 Bar Graph TemplatesA blank template to use for Line Plots, Picture Graphs, Bar Graphs, etc.4 Tally Graph Templates1 Pie Chart TemplateGraphing QuestionsEach graphing temp
Grades:
K - 8th
Types:
Leap Day (Leap Year) 2024 Math Activity (Algebra and Data) Digital or Printable
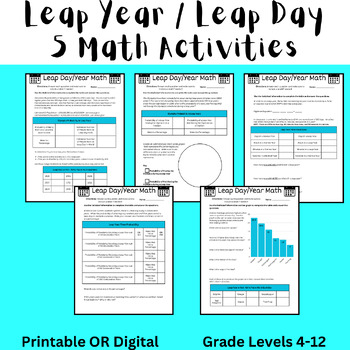
These 5 activities are fun NO PREP math activities to do to celebrate Leap Day 2024 (Leap Year 2024). The activities can be completed as 5 separate pages or as a 5 page packet. There is a customizable digital resource (Google Document) and a printable resource (Canva) that contain the same directions and activity. This was designed for students in middle school, but could be used for upper elementary and high school students in Pre Algebra, Pre-Algebra, or Algebra. In this assignment, students
Subjects:
Grades:
4th - 12th, Higher Education, Adult Education
Types:
Also included in: Leap Year (Leap Day) 2024 Bundle - Math, Reading, Writing, and Trivia
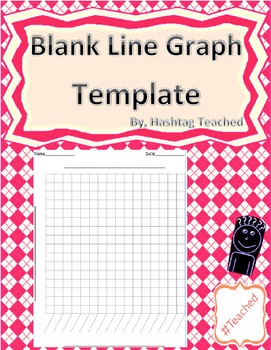
Blank Line Graph Template
Check out this simple and student friendly line graph template that teachers can easily use to teach students the parts of a line graph and use as they build their foundational skills. Apply best practice skills and use every minute of instruction by not wasting time by having students draw out their sloppy lines and simply glue this template in their math notebooks or take home with them to work on HW :) Also includes a side by side page for extra practice space!
Hashtag Teached Resources by #
Subjects:
Grades:
2nd - 9th
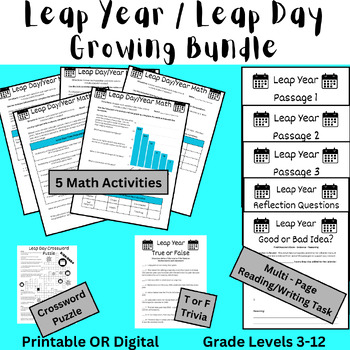
Leap Year (Leap Day) 2024 Bundle - Math, Reading, Writing, and Trivia
This bundle contains several fun and NO PREP activities to use to celebrate Leap Day 2024 (Leap Year 2024). Many contain a customizable digital resource (Google Document) and a printable resource (Canva) that contain the same directions and activity. These activities were designed for students in middle school, but could be used for upper elementary and high school students in Pre Algebra, Pre-Algebra, or Algebra.For more details on each product, click on the individual product to see the previe
Subjects:
Grades:
4th - 10th, Higher Education, Adult Education
Types:
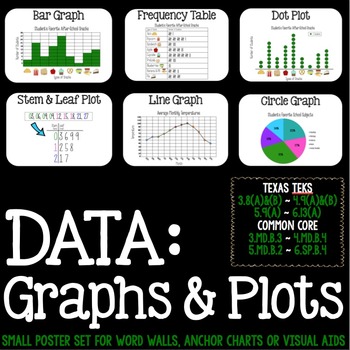
Math Vocabulary: Stem & Leaf, Dot Plots, Frequency Tables
This small poster set (each print out is 6.5 x 9.5) includes visual examples for:
- Bar Graph
- Frequency Plot
- Stem and Leaf Plot
- Circle Graph
- Line Graph
- Dot Plot
Great for word walls, anchor charts or visual aids in your classroom!
Subjects:
Grades:
3rd - 6th
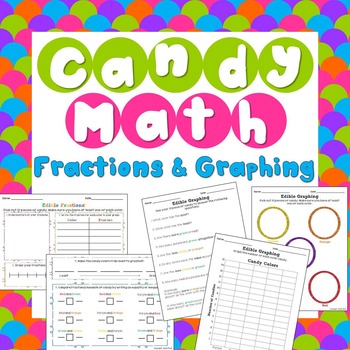
Candy Math- Fractions and Graphing
------UPDATED 7.6.2015------
This product now contains TWO versions of each activity. One for use with Skittles candy and one for use with Gummy Bear candy. Let students choose between the two or do the activity twice to monitor student learning.
Sweeten up fractions and graphing in your classroom with a little candy! Included are two math lessons that engage students using small amounts of Skittles (or similar) candy.
Contains (2 Versions of Each):
- Candy Organization Sheet
- Bar Graph
-Gr
Subjects:
Grades:
3rd - 6th
Types:
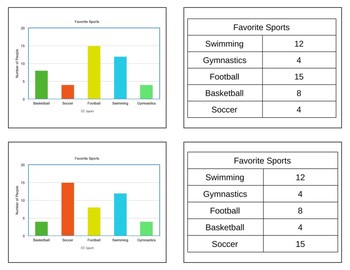
Bar Graph, Line Graph, Data Tables Matching
Use these matching cards to practice matching data tables with bar graphs, data tables with line graphs, or use them all together to play a huge game of memory! All graphs use the same 5 data points, so students will need to attend to both the data represented as well as matching the actual numbers on the graph & table. Use as a quick assessment in small groups or as a student run game during independent time. No prep or grading required!
Grades:
3rd - 6th
Types:
CCSS:
Showing 1-24 of 241 results


