Understanding Graphs PowerPoint Lesson
Teachers Unleashed
8.7k Followers
Grade Levels
3rd - 6th
Subjects
Resource Type
Standards
CCSS3.MD.B.3
Formats Included
- PPTX
Pages
37 pages
Teachers Unleashed
8.7k Followers
What educators are saying
My students were engaged and seemed like they enjoyed this. they asked questions and seemed to enjoy this lesson.
Description
Types of Graphs at the Movies
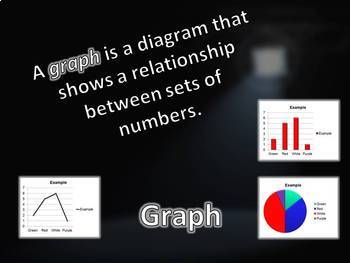
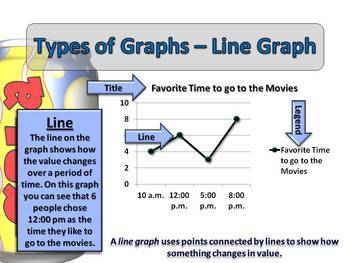
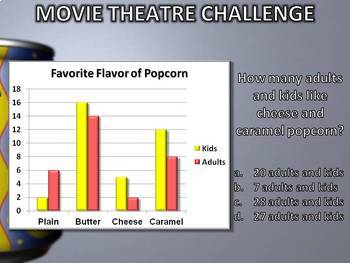
This 37-slide PowerPoint Presentation will give your students the tools they need to learn about bar graphs, double-bar graphs, line graphs, and pie charts. Students will review necessary graph vocabulary, walk through guided practice of each type (using strategies to understand what each question is asking), and complete the lesson with test prep style questions to determine mastery of the standard.
The theme of the PowerPoint is “Graphs at the Movies”, so students are sure to be engaged, while using prior knowledge. Bring graphing to life as you have fun teaching this math standard!
*****************************************************************************
You may be interested in a few of our other math presentations:
Smile! You're Coordinate Graphing
Long Division with the Johnson Family
Rounding Large Numbers with Marge PowerPoint
*****************************************************************************
Customer Tips:How to get TPT credit for future purchases:
Go to your "My Purchases" page. Next to each purchase, you'll see a "Provide Feedback" button. Simply click it and you will be taken to a page where you can give a quick rating and leave a short comment for the product. Each time you give feedback, TPT gives you feedback credits that you may use to lower the cost of your future purchases. We'd really love it if you'd rate our item after downloading! Feedback is so VERY important!
Follow our Store
Click on the green star next to our store logo to receive upcoming sales, freebie and product launches, and email updates!
Here's to a successful year!
Teachers Unleashed
Sam and Susan
teachersunleashed@gmail.com
Total Pages
37 pages
Answer Key
N/A
Teaching Duration
N/A
Report this resource to TPT
Reported resources will be reviewed by our team. Report this resource to let us know if this resource violates TPT’s content guidelines.
Standards
to see state-specific standards (only available in the US).
CCSS3.MD.B.3
Draw a scaled picture graph and a scaled bar graph to represent a data set with several categories. Solve one- and two-step “how many more” and “how many less” problems using information presented in scaled bar graphs. For example, draw a bar graph in which each square in the bar graph might represent 5 pets.


