Weather NGSS ESS2: pictographs, bar graphs, forecasting, predictions, posters
- Zip
What educators are saying
Description
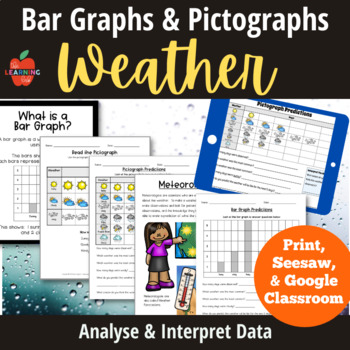
Weather Bar Graphs and Pictographs for observing, analyzing and interpreting data! This package is both printable and digital (for Seesaw AND Google Classroom.) NGSS ESS2: Earth's Systems. Look at typical weather patterns, use data to make predictions, and consider connections to seasons!
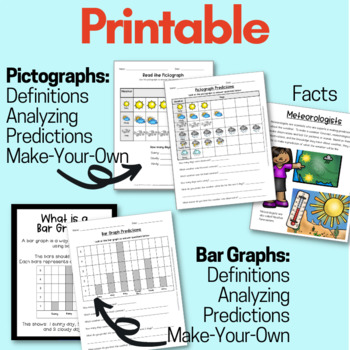
Printable 30 pages
* Weather Forecast Worksheets (3 versions)
*What is a Pictograph definition (2 versions)
*Read the Pictographs worksheets
*Meteorologist Fact Sheet (also with practice pictograph)
*Pictograph Prediction worksheets
*Make your own pictographs (2 versions)
*What is a Bar Graph definition (2 versions)
*Meteorologist Data Collection Fact Sheet (also with practice bar graph)
*Bar Graph Prediction worksheets
*Make your Own Bar Graph
*Monthly Data Bar Graph
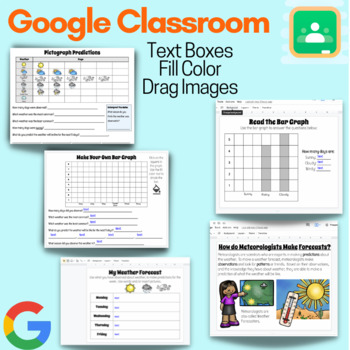
Google Slideshow digital format has the same sheets turned into 30 interactive slides! Includes student tips and a scoring rubric. (30 slides)
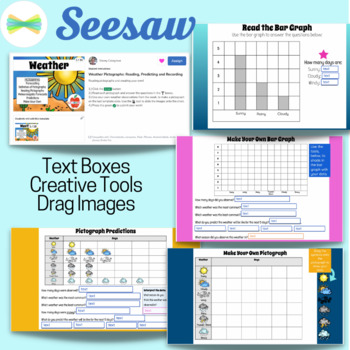
Seesaw digital format is separated into 2 activities, which can be added directly to your Seesaw Library! The Bar Graphs activity has 12 slides and the Pictograph activity has 15 slides, which includes the weather forecasting, as well!
"Typical Weather" conditions for this package include: sunny, cloudy, windy, thunderstorms, rainy, and snowy.
Thank you for visiting! Please leave feedback if you have time.
http://mrscolegrovesfourthgrade.blogspot.com/
http://www.teacherspayteachers.com/Store/Stacey-Colegrove
Copyright © 2016 Stacey Colegrove http://www.teacherspayteachers.com/Store/Stacey-Colegrove


