
Types of Graphs Posters


- PDF
What educators are saying
Also included in
 Save over 30% on this bundle of fun activities that will aid students in identifying and interpreting types of graphs including histograms, bar graphs, pie charts, line graphs, pictograms, frequency tables, and tally charts.With what standard do these resources align?This resource will aid studentsPrice $8.99Original Price $13.27Save $4.28
 If you are looking for a one-stop shop for middle school general science resources, you came to the right place! This growing bundle offers a wide range of activities and topics that will make teaching science a breeze.What does a growing bundle mean?Purchasing this growing bundle means that you savPrice $94.99Original Price $118.99Save $24.00
Description
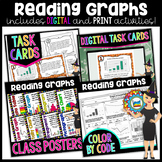
Looking for simple but effective visuals for types of graphs? This poster set will look great in your classroom and give students a quick reference guide for selecting the appropriate type of graph for their data.
Included:
✔ One multi-color set with black background.
✔ One multi-color set with white background.
Each set includes a poster for Data Chart, Bar Graph, Histogram, Pie Chart, Line Graph, Tally Chart, Frequency Table, & Pictograph.
Each poster includes a description of when each graph should be used and a picture representation.
I have included an 8 1/2" by 11" poster topper and a 11" by 17" poster topper in each pattern. You can see what the larger one looks like in the preview file. I had it printed at our local copy shop for less than $2.
Connect with me
Visit The Morehouse Magic Blog
The Morehouse Magic on Facebook
