Science Fair Project Organizational Tools
Rose STEM
58 Followers
Grade Levels
3rd - 6th
Subjects
Resource Type
Standards
CCSS3.MD.B.3
CCSS3.MD.B.4
CCSS4.MD.B.4
CCSSW.3.1
CCSSW.3.2
Formats Included
- PDF
Pages
6 pages
Rose STEM
58 Followers
Description
Science Fair time means lot of questions from parents and students! These tools I've created will help to put you, your students, and your parents at ease by showing how to organize a successful science fair project! You will be able to use these handouts year after year!!
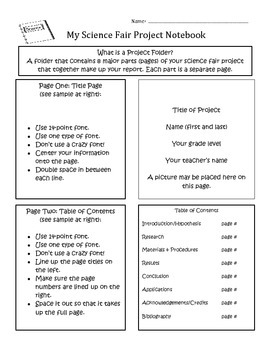
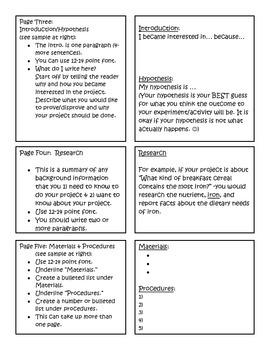
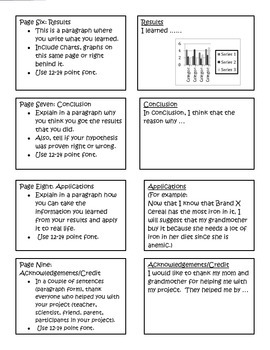
You will get a four page handout to give your students/parents that gives detailed page by page directions on how to organize the project notebook. The project notebook explains how to set up the report which includes the introduction, hypothesis, research, materials, process, results, conclusion, applications, acknowledgments, & bibliography.
You will get a one page handout that explains what a log book is and what should be written inside.
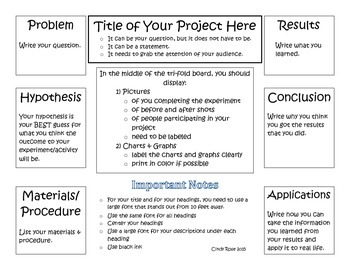
You will receive a one page handout that explains what should be on the project display board and how to organize it.
Take the headache out of explaining to students and parents how to organize a science fair project.
Total Pages
6 pages
Answer Key
N/A
Teaching Duration
N/A
Report this resource to TPT
Reported resources will be reviewed by our team. Report this resource to let us know if this resource violates TPT’s content guidelines.
Standards
to see state-specific standards (only available in the US).
CCSS3.MD.B.3
Draw a scaled picture graph and a scaled bar graph to represent a data set with several categories. Solve one- and two-step “how many more” and “how many less” problems using information presented in scaled bar graphs. For example, draw a bar graph in which each square in the bar graph might represent 5 pets.
CCSS3.MD.B.4
Generate measurement data by measuring lengths using rulers marked with halves and fourths of an inch. Show the data by making a line plot, where the horizontal scale is marked off in appropriate units-whole numbers, halves, or quarters.
CCSS4.MD.B.4
Make a line plot to display a data set of measurements in fractions of a unit (1/2, 1/4, 1/8). Solve problems involving addition and subtraction of fractions by using information presented in line plots. For example, from a line plot find and interpret the difference in length between the longest and shortest specimens in an insect collection.
CCSSW.3.1
Write opinion pieces on topics or texts, supporting a point of view with reasons.
CCSSW.3.2
Write informative/explanatory texts to examine a topic and convey ideas and information clearly.


