19 results
Graphing posters for Microsoft PowerPoint
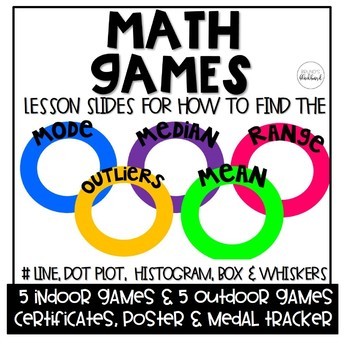
Math Games: Mean, Median, Range, Outliers & Graphs
Math Games
Students will learn how to find the mean, median, mode, range, range playing Olympic style games while practicing and creating Number Lines, Box Plot, Histograms and Box and Whiskers graphs.
This product is a zip file that contains a PowerPoint teaching how to find the mean, median, mode, range, outliers, number plot, dot plot, histogram, box and whiskers, 10 games and an editable create your own game. As well, a PDF file which has posters, awards and placing ribbons. Plus, 2 folda
Subjects:
Grades:
Not Grade Specific
Learning How to Graph
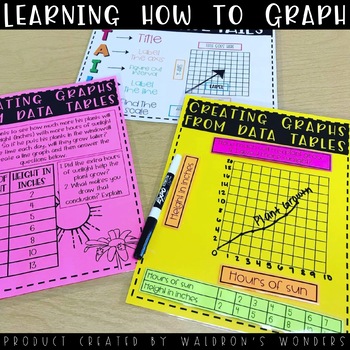
In this product you will find:-How to graph power point to go over the TAILS graphing procedure-Printable 8.5x11 posters for the students to use as a reference to use TAILS-A cut out of TAILS for their interactive notebooks-Creating graphs from word problems and data tables practice (6 different full page printables)-Creating graphs from data tables printables manipulatives (cut and glue/velcro/magnets etc. See product pictures for how I made them with Velcro!-Independent practice (could be a qu
Subjects:
Grades:
4th - 12th
Types:
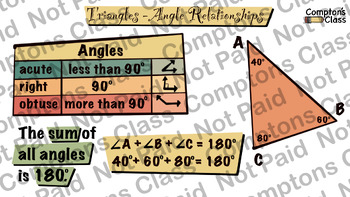
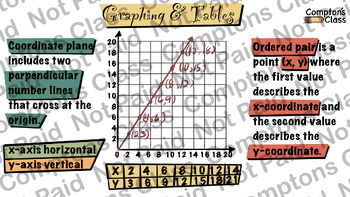
Compton's Class Algebraic Representations 6th Grade Math Package
4 Anchor Charts that deals with Algebraic Representations.
Grades:
6th
CCSS:
Types of Graphs: Anchor Charts & Graph Visuals for Math Wall Center Printables
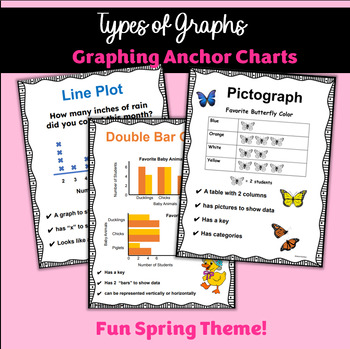
This fun spring theme graph instant download printable resource on different types of graphs includes seven 8.5 x 11 anchor charts with minimal clip arts to focus on the specifics of the graphs. Each page has a title, definitions, and examples of each type of graph with fun spring graphs with a spring theme. Print and post these graph visuals to help students remember or refer back to, the different types of graph. Put them on your math word wall, math vocabulary wall, or at math centers and sta
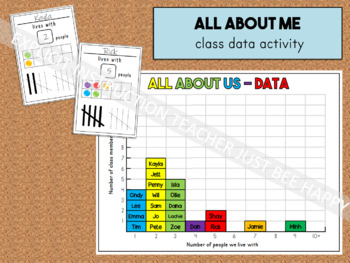
Maths All About Me Whole Class Data Activity Graphing Start of the Year
Fun start of the year Maths activity for Pre-Primary to Year 2 students (Australia)Editable PowerPoint filesMini-sheets are 4 to a page (A4)Class graph sheet is A3Free fonts embedded in files:-Henchgirl comic-The Bold Font-Primer Print
Grades:
PreK - 2nd
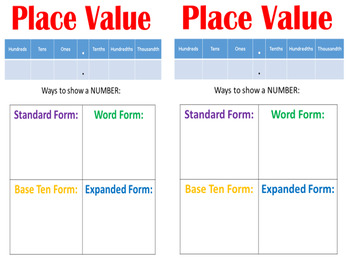
5th Grade Interactive Math Anchor Charts
I created this product because I was really bad at doing Math anchor charts in my class because I am OCD and don't like to put messing things on my classroom walls. I created this to help me guide my students to understand all of the TEKS they need for the STAAR. However, this can also be used for Common Core.
Within this product is a PowerPoint of Interactive Slides of the anchor charts. Another PowerPoint with slides that have the answers so you can turn into posters if your school has a pos
Subjects:
Grades:
3rd - 6th
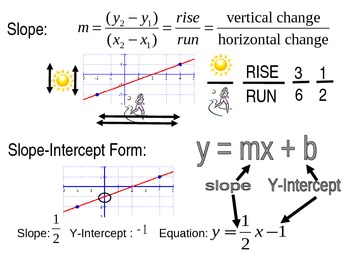
Slope, Intercept, Equation Poster
Print this poster and enlarge it to help your students with Slope, Intercept, and Equations. Graphics make it easy for students to remember to use Rise over Run to find slope.
Grades:
6th - 9th, Adult Education
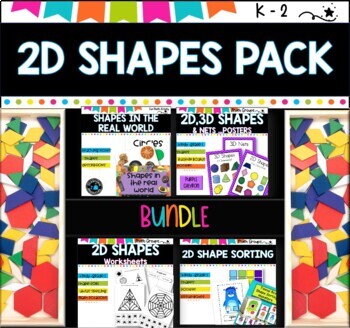
2D Shapes BUNDLE I Worksheets I Shape sorting I Posters
⭐2D Comprehensive bundle- worksheets, game, photos for picture talks, and Posters⭐This bundle has so many fantastic engaging worksheets and activities for you✅2D Shapes are made into a fun activity using the Tissue box monsters for sorting pattern blocks. Easy to make out of old tissue boxes, making them inexpensive to create.✅Shape PostersThis bundle is packed with fun, engaging activities that will teach your preschool, pre-k, or kindergarten students the basic shapes and their characteristics
Grades:
PreK - 1st
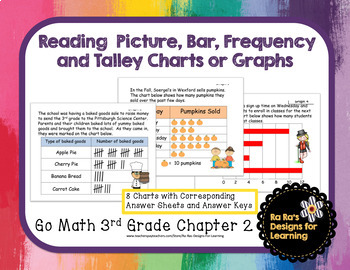
Reading Picture, Bar, Frequency and Talley Charts
This product was designed to coordinate with Go Math 3rd Grade Chapter 2 Represent and Interpret Data but can be used more broadly since it is geared toward 3rd Grade Math Common Core standards.Product contains 8 charts that can be displayed on a smart board or printed and laminated for math center work. Each chart has a corresponding answer sheet with answer key.

Gr 3 Go Math! Ch. 2 Essential Questions and Journal Prompts
Content in this poster set is from the 3rd grade go math series
Chapter 2 and is organized by lesson.
Essential questions and journal prompts for each lesson with
Common core standards to match is included on every slide.
Could be used to display on the SmartBoard for students to
summarize/reflect on the day’s lesson. In my classroom, I use
these to help students practice writing in the math workshop.
Great for your focus wall too!
CC.3.MD.3 and CC.3.MD.4
Subjects:
Grades:
3rd
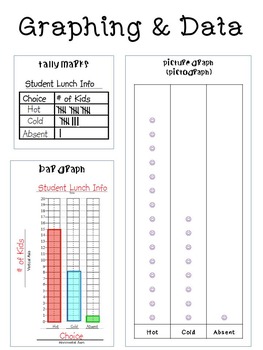
Common Core Math: Graphing & Data Poster
This poster shows how different graphs can show the same data - tally marks, a picture graph, and a bar graph are featured, showing the same set of data.
OR purchase as part of my Common Core Math Poster Pack!
Subjects:
Grades:
K - 3rd
CCSS:
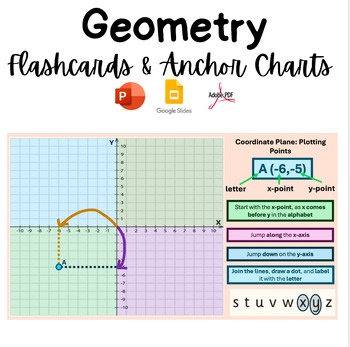
Geometry: Flashcards & Anchor Charts!
Flashcard / Anchor Chart resources that will help to embed mathematical principles and practices of Geometry!If you like this, you'll love this:Geometry Mega Bundle Pack!Math Flashcards Bundle Pack!Geometry Assessment Pack!5th Grade Full-Year Math Bundle Pack!All resources are editable, and can be used with PowerPoint, Google Slides or PDF.Useful How-To, Step-by-Step guide with mathematical practices, including animations on PowerPoint & Google Slides, that allow students to follow the corre
Subjects:
Grades:
Not Grade Specific
Types:
Also included in: Math Flashcards & Anchor Charts!
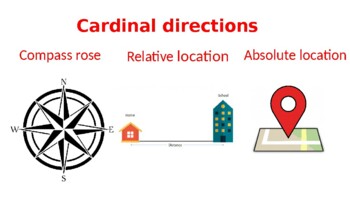
Landforms and Map skills
Cardinal directionsContinents and oceansMap keyMap gridLandforms (land and water)
Grades:
1st - 3rd
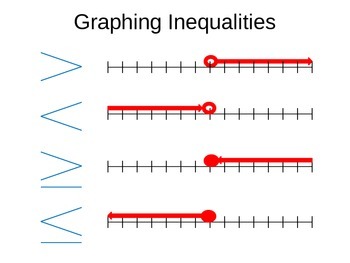
Graphing Inequalities Visual Poster
This is a visual math poster I created for my students who had trouble remembering which direction the line goes and whether to use an open or closed circle when graphing inequalities.
Grades:
6th - 9th
Types:
CCSS:
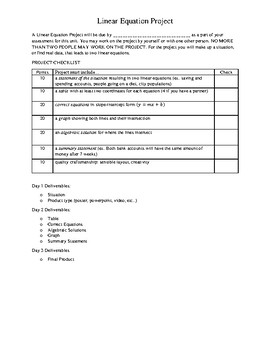
Linear Equation Project
Students will create a real life situation that will produce two linear equations. Students should make two tables based on the situation, then pick two points from each table to create an equation respective to each table. Next, they should set the two equations equal to each other to find the intersection. Afterwards, they should graph and translate all work on to a poster or powerpoint. The PDF is a physical space for students to document each part of the process. Aligned to CCSS ACED2 REI10
Grades:
7th - 9th
CCSS:
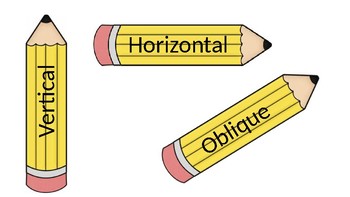
Horizontal, Vertical, Oblique Poster
This poster displays pencils turned horizontal, vertical, and oblique. Pencils can be cut out if you choose.
Subjects:
Grades:
1st - 8th

Bar and line graphs
I have a series of powerpoints that I created when going over bar and line graphs. They are very easy to edit and they go over step by step how to create a graph.
Subjects:
Grades:
4th - 6th
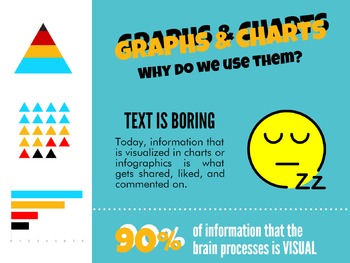
Choosing Charts & Graphs
Pie? Bar? Line? How do I decide?
This slideshow briefly discusses the difference between pie charts, bar graphs, and line graphs. It has examples of what each graph looks like and recommendations for when each graph should be used.
2 files included:
- printable version, 3 pages
- slides with larger versions of images, 6 pages
I'd love to hear from you in the comments below - don't be shy!
Grades:
6th - 9th
Showing 1-19 of 19 results


