6 results
Kindergarten graphing scaffolded notes
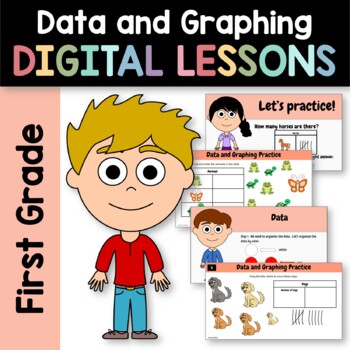
Data and Graphing 1st Grade Interactive Google Slides | Math Review
Teach data and graphing for first grade with these two interactive digital Google Slides Presentations. What's included? One Google Slides interactive presentation with 38 slides that teaches about data and graphingOne Google Slides interactive presentation with 10 slides where students can practice more by moving objects, entering answers, filling color, and more, all digitallyPowerPoint presentations of same contentPDF versions of same contentAnswer keysInstructions for setting up your Google
Subjects:
Grades:
K - 2nd
Types:
CCSS:
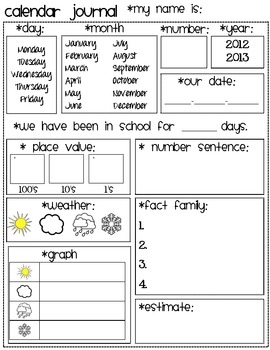
Calendar Journal-Daily Review of Common Core Standards
I have printed this and laminated it for my students to use daily during calendar time. I created this after my students took their Galileo pretest (a test our school gives that measures the knowledge on all grade level standards). I focused this journal on the skills they struggled on. They take the test again mid year and their scores drastically improved. Anyway, my first graders complete this journal daily whole group in our 15 minute calendar block. We had to start off doing only some
Subjects:
Grades:
K - 4th
Types:

Pictographs & Bar Graphs
In an effort to make high quality educational material more accessible to parents and teachers alike, regardless of location and/or socioeconomic status, I have decided to post lessons I create on here for FREE. The products I make consist mostly of Google Slides in PDF format for K-8th grade students. They cover a wide range of subject matter, but focus mainly on math and language development. Each lesson is created with the intention of keeping students attentive and actively engaged by using
Subjects:
Grades:
K - 3rd
CCSS:
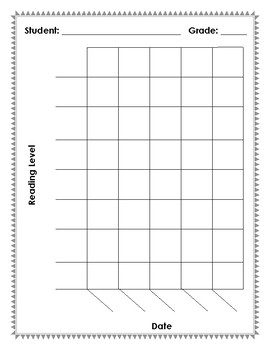
Reading Level Grapher
Use this bar graph with students to track their Reading Levels.
There are many ways to use this graph for students, teachers and parents.
Integrate this bar graph as students are also learning about graphing in mathematics. Teachers can make students self-graph and keep track of their learning. As students' ZPD levels of reading increase, let them know it!
As students increase, allow them to add the new date and fill in the graph to the level at which they are now at.
Use AR levels, Lexile
Subjects:
Grades:
K - 6th
Types:
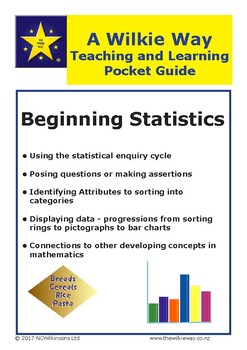
Wilkie Way Pocket Guide To Beginning Statistics
Download this file to your phone or tablet to give you a handy guide to the early stages of teaching and learning about statistics.
What should your students understand about the statistical inquiry cycle and what sort of data displays are appropriate. At this level interpretation focuses on comparisons.
Early progressions in statistics underpin most other areas of the curriculum.
Subjects:
Grades:
PreK - 1st
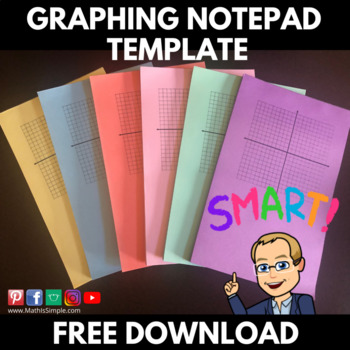
Graphing Notepad Template
RUN OUT OF GRAPH PAPER? Download this Free Graphing Notepad Template for your classroom! These teacher created notepads work well with students in collaborative groups or a fun teacher math gift on your first day of school!This template was created and printed at our District's Teacher Resource Center. These notepads can be made at your local office supply store. Follow us on Instagram, Facebook, Pinterest, YouTube or Teacher Pay Teachers
Grades:
K - 12th, Adult Education, Staff
Showing 1-6 of 6 results


