76 results
Graphing independent works for Microsoft Excel
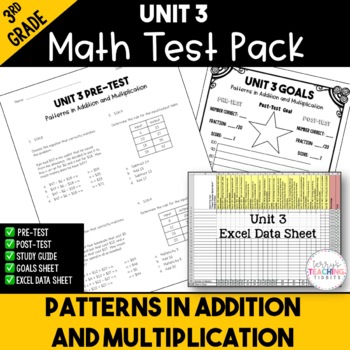
Patterns in Addition and Multiplication Printable Test Pack {3rd Grade Unit 3}
Make assessment administration incredibly easy with this printable test pack.What You Get:a printable pre-and post-test for the unit (20 questions, multiple choice)Excel data sheets to show student growth study guides to help students prepare for the post-testa student goals sheets for your class to track their growth from the beginning of the unit to the endA link to a tutorial video on how to use the Excel data sheetThis test is aligned to the Georgia Standards of Excellence Unit 3: Patterns i
Subjects:
Grades:
3rd
Types:
Also included in: 3rd Grade Printable Math Test Bundle
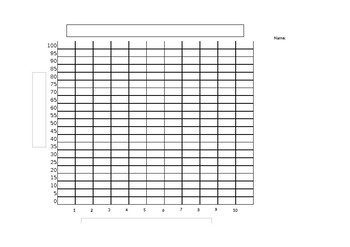
Blank (line or bar) Graph
This product can be for multiple uses! It contains a numbered x and y axis, a blank heading for students to write in a title, and blank headings for axis labels.I used the blank graph for my students to graph their test scores and then mark their goal for their next test creating an accountability factor for testing.
Grades:
Not Grade Specific
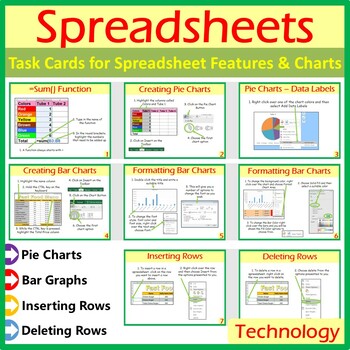
Microsoft Excel Spreadsheet Features & Chart Task Cards Help Cards
A wonderful set of 8 task/instruction cards which can be printed and laminated and then given to students to help them learn and practise the following features in Microsoft Excel:• =sum()• Creating pie charts• Inserting data labels on pie charts• Creating bar charts• Formatting bar charts• Inserting rows in spreadsheets• Deleting rows in spreadsheetsOther Microsoft Excel Products Available:• Microsoft Excel Bundle 1: Click Here• Microsoft Excel Bundle 2: Click Here• Grades 1- 4: Microsoft Excel
Grades:
Not Grade Specific
Types:

Water Balloon Catcher Project - Data and Graphing - Mathematics
Transform your maths classroom into a dynamic hub of learning with this captivating data and graphing project! Designed for upper primary/middle school students, this hands-on and inquiry-based activity ensures an immersive experience in mastering data interpretation, chart creation, and understanding the role of data and graphs in advertising.In this engaging project, students will: Explore Data: Collaborate in teams to design and construct a Water Balloon Catcher using recycled materials, each
Subjects:
Grades:
5th - 9th
Types:
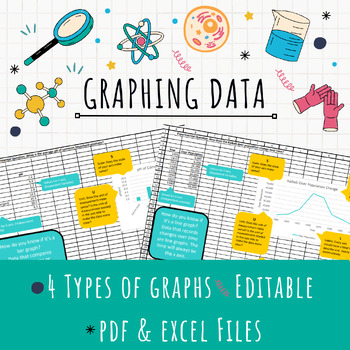
EDITABLE Excel Graphing Template
Teach graphing in Excel with this EDITABLE template! After collecting data, have your students represent it in a formal graph using Excel. This template provides helpful tips for students to determine the right kind of graph (bar, line, or pie) for their data and ALSO teaches them all the important parts of a graph.Assign the template for students to download and edit for a quick graphing solution or provide the pdf handouts for students who just need a little guidance!4 different kinds of graph
Grades:
7th - 12th
Types:
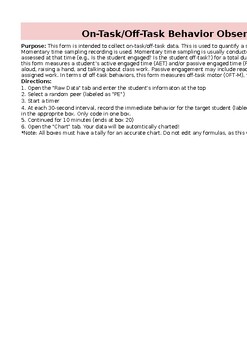
Behavior Observation Academic Engagement and Time on Task (BOSS) AUTO GRAPH
This form is intended to collect on-task/off-task data. It will AUTO graph. This is used to quantify a student's academic engagement and off-task behaviors. Momentary time sampling recording is used. This form measures a student’s active engaged time (AET) and/or passive engaged time (PET). In terms of off-task behaviors, this form measures off-task motor (OFT-M), verbal (OFT-V), and passive behaviors (OFT-P). EXCEL DOCUMENT.
Subjects:
Grades:
Not Grade Specific
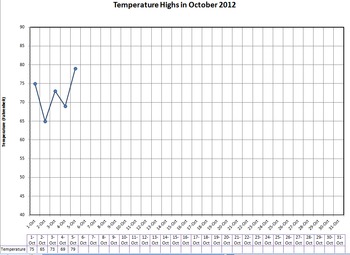
Graph Daily Temperature - with handout
Lots of downloads, are there any comments or votes for me? :)
Type in the daily temperature on your computer with your students and it will automatically graph it for you as you type. You can pre-print the monthly graph for everyone in your class and they can follow along and graph with you. I use it with calendar math or other daily activities.
Great for explaining the scales of a graph and practicing accuracy in graphing and using rulers to connect lines. Look for trends in weather and a
Subjects:
Grades:
3rd - 6th
Types:
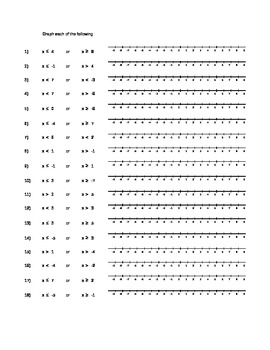
Compound Inequality Graphing Practice
This excel spreadsheet includes a sheet of practice for both AND and OR compound inequalities. There are also three sheets of blank number lines, so that a teacher could write their own inequalities for students to graph.
Grades:
5th - 9th
Types:
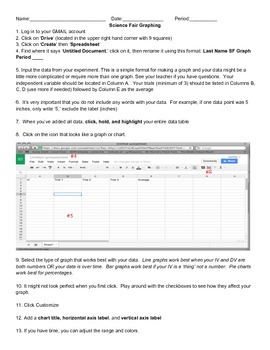
How To Graph Using Google Spreadsheets
This is a step-by-step guide on how to use Google Spreadsheets for students in grades 5-12. Use this as a resource when guiding students through the process. Included with the directions is sample data for students to use when practicing graphing. Perfect for science experiments and science fair!
Subjects:
Grades:
5th - 12th
Types:
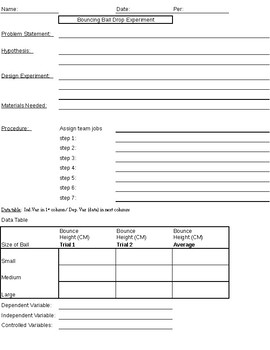
Science: Simple Bouncing Ball Experiment With Data Table & Graph Practice
This simple experiment can be used in open inquiry by giving students three different sized balls and a meter stick so they can design their own experiments. Included (all black & white pages - easy to copy): (1) teacher reference page to give students much or little guidance.(2) pages for students to write a problem statement, hypothesis, experiment design, materials needed, procedure, data table (for independent and dependent variables), an area for a graph, and conclusion. Some Ideas F
Subjects:
Grades:
Not Grade Specific
Types:
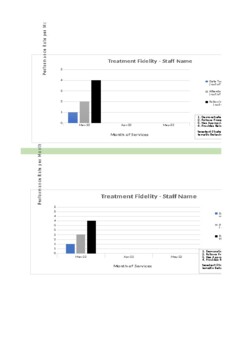
Fidelity Check with Graphs (Short)
Keep track of staff and treatment fidelity without distractions with this (weekly/monthly) checklist. Graphing is automatic and will generate based on the formula. Fully customizable to your companies specific goals and needs.
Subjects:
Grades:
Staff
Types:
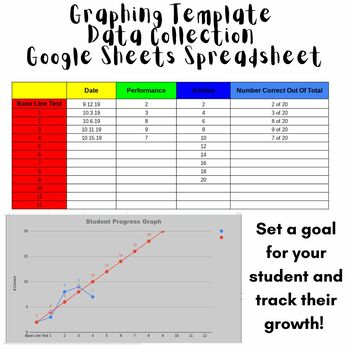
Data Collection Graph Template - Great for IEP GOALS!
Organize your data for students GOALS! Great way to TRACK and show GROWTH for progress monitoring with IEP GOALS, or really...any goals your students have! This is a spreadsheet set up for google sheets. All you need to do is enter the students information, their goal, and start tracking! Enter each time you test a student how they do, and a graph will be generated.
Subjects:
Grades:
Not Grade Specific
Types:
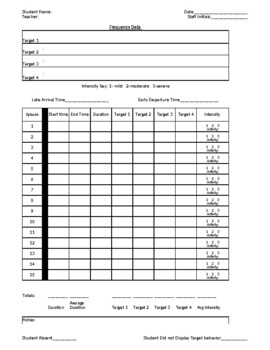
Behavior Frequency Rate Chart w/ Target, Intensity, Duration, BIP chart/Summary
Behavior Frequency Rate Chart (dates and chart cant be edited and dates changed to current year or target)--Daily Sheet-Date Entry-Intensity Chart-Duration Chart-Target Charts-BIP Evaluation printout -BIP write upSee preview for description Excel format for editing - tabs at bottom of page for easy change of view and data entry
Subjects:
Grades:
PreK - 12th
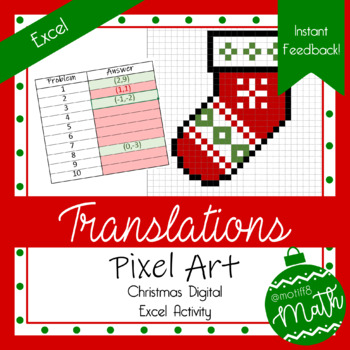
Christmas Pixel Art | Translations | Digital Geometry | Instant Feedback
Product Description: This Christmas themed, pixel art activity covers translations! Students are given three points on a graph and asked to translate one of the points according to the given translation rule.Objective: Students will be able to translate a point on a graph.Excel Student Instructions: Students will work all ten problems on the problems tab and then input their answers on the image tab. When entering their answers, students must use parentheses, a comma, and NO spaces. As students
Subjects:
Grades:
7th - 11th
Types:
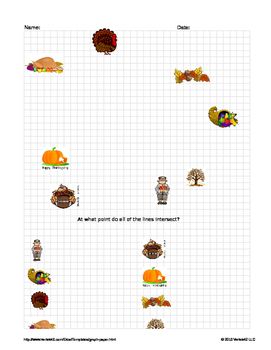
Point-Slope Form Turkey Hunt (Thanksgiving)
use this activity with your students to practice Point-Slope form. Worksheet comes as an excel file with different options. You can have students draw given lines that hit each of the graphics on graph and find the intersecting point OR have students create their own lines that hit each of the graphics and write an equation for those lines.
This is a quickly put together activity, I will go back and edit it for beauty and glamour over the break weekend :)
Grades:
8th - 12th
Types:
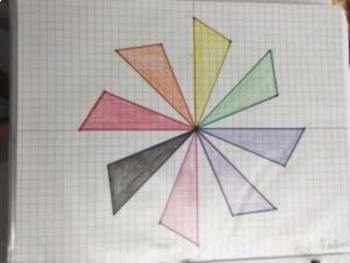
Windmill Rotations
This is a great culminating activity after Rotations are taught. Students will need to be able to do Rotations 90, 180 degrees around the origin, as well as use a protractor and ruler for 45 degrees around the origin.
Great also as a review or just a fun-Friday activity.
Subjects:
Grades:
8th - 10th
Types:
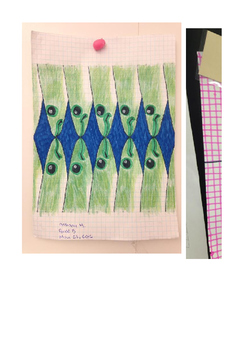
Parabola Art
this is a great activity to do after teaching the vertex form of the quadratic equation. Also very good for understanding 'domain.' Kids construct 10 parabolas based on specific domain. This is especially fun for kids that are artistic.
Subjects:
Grades:
8th - 10th
Types:
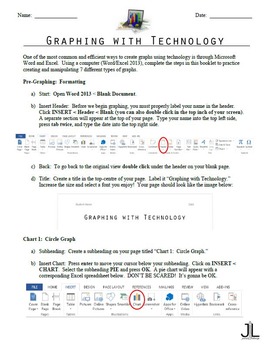
Graphing with Technology (Microsoft Word/Excel 2013)
Help students learn to create graphs using technology! This graphing with technology booklet acts as a compressed guide and practice sheet for Microsoft Word/Excel 2013.
Each graph contains step-by-step directions and screen-capture images so that students will never get lost. In addition, the data used in this assignment is both relatable and engaging for teenage target groups.
By completing this task, students will be able to create 7 different types of graphs using technology:
- pie gra
Subjects:
Grades:
8th - 12th, Higher Education, Adult Education
Types:
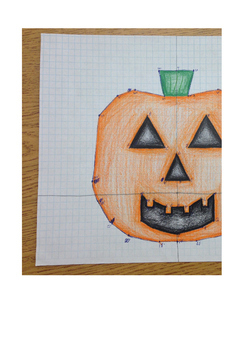
Pumpkin Transformations
This is a fun, artistic activity involving graphing on the coordinate plane, translations, and reflections. It is a great activity after translations and reflections have been taught, and best for doing in the
fall as the outcome is a pumpkin.
It could also be used as an assessment.
Materials needed: pencil, graph paper, crayons/markers/colored pencils.
Grades:
7th - 9th
Types:
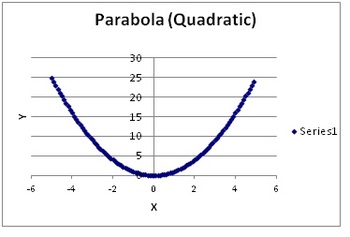
Graphing and Analyzing Functions on a Spreadsheet
This math activity allows students to investigate the behavior of functions (Quadratic, Cubic, Hyperbolic and Exponential) by adjusting the domain over which the functions are viewed. Students are guided with step by step instructions on how to program a blank spreadsheet to graph functions of their choosing over intervals that they specify. Graphs are manipulated and students are guided to look at growth rates of functions and how they behave as they approach larger and smaller values. Real
Subjects:
Grades:
10th - 12th
Types:
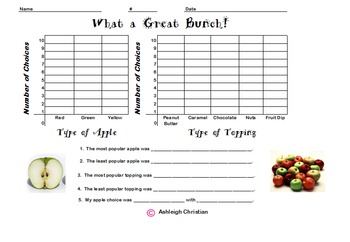
Third Grade Graphs with Tally Chart
This product is a collection of graphs to teach children how to take a poll and graph the information. There are also comprehension questions. Graphs about age, M & M's, favorite pets, apples and favorite cookies. Enjoy!
Subjects:
Grades:
3rd
Types:
Task Cards for An Introduction to Microsoft Excel 2010
Thank you for choosing Task Cards for An Introduction to Microsoft Excel 2010. This set includes 24 task cards. 12 for Identifying definitions and 12 for labeling. If you see any errors please feel free to inbox me. Please leave comments and rate. Most of all I hope you and your students find this beneficial.
Thank you
Grades:
6th - 12th
Types:
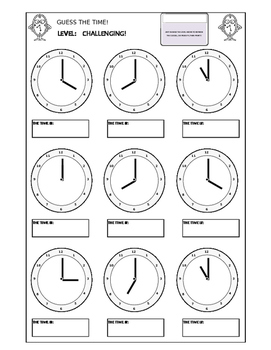
Clocks - Guess The Time
An easy way to produce hundreds of clock worksheets so that your students can practice working out the time. This is an Excel worksheet with 9 clocks, that refresh randomly to produce any number of random print outs.
There are three levels (Challenging, Really Hard, and Nightmarish!), corresponding to Easy (K, G1), Medium (G2, G3) and Hard (G4, G5). You only have to change levels or refresh the page (F9 for a PC) and you have a new sheet.
Tab 1 ("GUESS") is for guessing the time from a clock.
Subjects:
Grades:
K - 7th
Types:

Easy Math Classroom Assessment Tracker - Excel Bar Graph Formulas Pre-Loaded
This Excel file includes classroom Math proficiency trackers for schools with Pre-Tests, two or three Benchmark Assessments, and a Post-Test compared to district averages. I've also included a how-to tab and a completed example.
The file defaults to a Galileo Achievement tracker... but it is easy to edit the text if your school conducts other standardized assessments.
In just two easy steps you'll have a great visual prepared for your students:
Step 1: Enter data in the % Proficient boxes
St
Subjects:
Grades:
1st - 8th
Types:
Showing 1-24 of 76 results


