61 results
Graphing independent works for SMART Notebook
3rd Grade Math Jeopardy SMARTboard Review ~ CCSS ALIGNED!
This is a SMARTboard .notebook file that reviews 3rd grade math standards.
CCSS Standards Addressed
3.NBT Numbers and Operations in Base Ten
3.NF Numbers and Operations in Fractions
3.NA Numbers and Algebraic Reasoning
3.MD Measurement and Data
3.G Geometry
The preview file contains information for the file and how to play the game. I have left multiple questions live so you can see exactly how the pages link while playing the game. You will notice on the gameboard that all the red numbers ar
Subjects:
Grades:
3rd - 4th
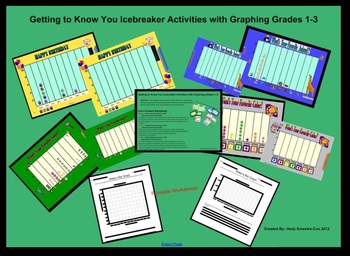
Getting to Know You Icebreaker Activities w/ graphing using smartboard Grade 1-3
Getting to know you icebreaker activities with graphing for Grades 1-3 .This Smart Notebook file was created to use with your Smartboard. This 12 page file is a great lesson to use on the first day of school. This lesson will help you get to know your students and help your students feel at ease while collecting data and graphing. This file includes four interactive graphs, Objectives with the Core Content Standards, student worksheets, and even a Happy Birthday tune to use throughout the year.
Grades:
1st - 3rd
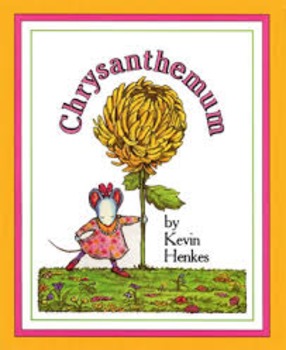
Chrysanthemum Name Graph
An interactive name graph for your students to compare the length of their name to their classmates.
Subjects:
Grades:
K - 2nd
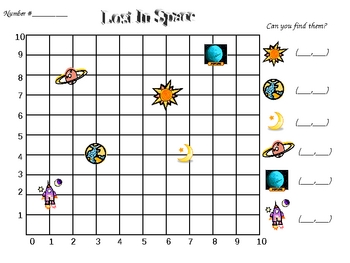
Space Coordinate Grid
Students discover how to read and plot space objects on a coordinate grid. Students learn the easy way to remember the clue of "dribbling and shooting" to plot or read the graph. There is a student sheet embedded in the attachments file section of this SmartBoard lesson.
Subjects:
Grades:
1st - 4th
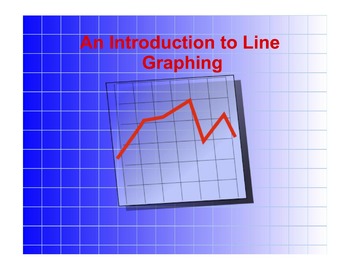
Introduction to Line Graphing (A Smartboard Presentation for 3rd - 5th Grade)
Graphs are terrific organizers! They can present information in a useful, accessible way. However there are so many things to remember when setting up a graph.
This Smartboard presentation goes through the basics of setting up a line graph, starting with the x and y axis, how to organize the information on each axis, how to plot points, and label information on a graph. This is a great introduction that touches on all of the basics of graph organization and set up.
Subjects:
Grades:
3rd - 5th
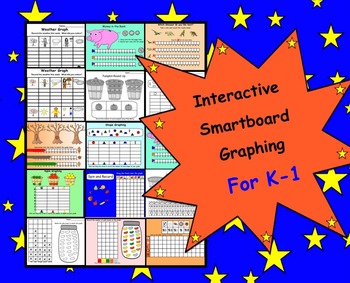
Interactive Smartboard Graphing for K-1
This is a Smart Notebook File. You must have Smart Notebook Software to download this product.
There are 15 pages in this file.
Page 1 Shape graphing activity, students count and record the number of shapes onto the graph by sliding the arrow.
Page 2 Apple graphing, students record red, green and yellow apples.
Page 3 Money graph, students drag coins into the piggy bank and then graph the number of coins. (US coins)
Page 4 Same as above in Canadian coins.
Page 5 Students must read the gr
Grades:
K - 1st

March Lion and Lamb Graph for the Smart Board
Teachers and students can keep track of the weather in March (Did it "Roar in like a lion and out like a lamb...") with this interactive smart board slide. Students can make predeictions and also use the data to answer mathmatical questions about the graph (most/least/how many more etc).
There is also a March Poem included for discussion and shared reading.
Subjects:
Grades:
K - 2nd
![Preview of 5.OA.3 SMART Board Lessons [77 Slides, ~1 week of instruction]](https://ecdn.teacherspayteachers.com/thumbitem/5-OA-3-SMART-Board-Lessons-77-Slides-1-week-of-instruction--2418002-1657529148/original-2418002-1.jpg)
5.OA.3 SMART Board Lessons [77 Slides, ~1 week of instruction]
**This product was created using SMART Notebook 11**
This is a collection of lessons created to address the 5.OA.3 common core standard for fifth grade.
The lessons include:
-I do, we do, you do model for each lesson.
-Spiral review warm-up word problems for each lesson from the 5.NBT.5 (multi-digit multiplication), 5.NBT.7 (operations with decimals), and 5.NF.7 standards (fraction division).
-Guided steps on how to use a table to describe the relationship between number patterns.
-Guided step
Subjects:
Grades:
5th
CCSS:
Recognize Proportional Relationships
Common Core Standard 7.RP.2.a
Decide whether two quantities are in a proportional relationship, e.g., by testing for equivalent ratios in a table or graphing on a coordinate plane and observing whether the graph is a straight line through the origin.
Use the following Smart Board pages as a center, as an alternate teaching format for small groups or 1:1, or as formative or summative assessment.
You can also print and laminate the pages to use with dry erase markers for discrete t
Subjects:
Grades:
6th - 8th
CCSS:
Back to School Math Review for First Grade Smartboard
This 15-slide jeopardy style math review game will see what your students remember from first grade. Topics include place, number order, money, time, measurement, shapes, graphing, and problem solving. Created by Dijobaker
Math Review Smartboard; Math Review Lesson
Subjects:
Grades:
1st - 2nd
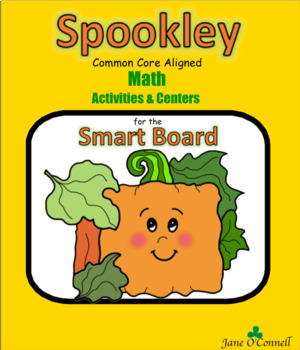
Spookley Math Centers & Activities for the Smart Board
This is a 45 page product for the Smart Board. It is a Common Core Aligned product that can be saved as a printable pdf. to accompany the lessons or centers.It features the popular and familiar character Spookley the Square Pumpkin.The product contains:-comparing numbers 1-10 using Spookley and other pumpkins for the story-an audio component that has a farmer "speaking" and asking for a particular amount of pumpkins into a ten-frame-graphing pumpkins from the story-sorting pumpkins by shape and
Subjects:
Grades:
PreK - 1st
One Step Equations and Inequalities Review Quiz Smartboard Slides Lesson
Math Teachers ~ In this smartboard lesson, you are getting 32 slides, fabulous re-teaching, review, practice for Solving-1-Step Equations-and-Inequalities. LOTS of practice problems, as well as re-teaching and re-explaining. QUIZ is also provided on last two slides. Everything you need for a Smartboard-slides-lesson to review, reteach and practice Solving Equations and Inequalities! You'll LOVE this resource and use it year after year! WARNING: You MUST have SMART Technologies SMART software, an
Subjects:
Grades:
5th - 8th, Staff
Box and Whisker Plots Smartboard Slides Lesson St. Patrick's Day Theme
This Box and Whisker Plots Smartboard Lesson teaches students how to create a Box Plot step by step. LOTS of practice in creating and reading Box and Whisker Plots, along with an Interactive QUIZ on Box Plots. These slides have a St. Patrick's Day clipart theme. In case you don't want that, I also have the SAME Box and Whisker Plots Smartboard Lesson on everyday math slides as well. https://www.teacherspayteachers.com/Product/Box-and-Whisker-Plots-Smartboard-Lesson-Step-by-Step-How-to-Constuct-
Subjects:
Grades:
5th - 7th
![Preview of 5.G.1 SMART Board Lessons [98 Slides, ~1 week of instruction]](https://ecdn.teacherspayteachers.com/thumbitem/5-G-1-SMART-Board-Lessons-98-Slides-1-week-of-instruction--2404712-1657529084/original-2404712-1.jpg)
5.G.1 SMART Board Lessons [98 Slides, ~1 week of instruction]
**This product was created using SMART Notebook 11**
This is a collection of lessons created to address the 5.G.1 common core standard for fifth grade.
The lessons include:
-I do, we do, you do model for each lesson.
-Spiral review warm-up word problems for each lesson from the 5.MD.2 standard (fractions on line plots).
-Guided steps on how to describe the location of points on the coordinate plane.
-Guided steps on how to find the distance between points on the coordinate plane.
-A review on
Subjects:
Grades:
5th
CCSS:
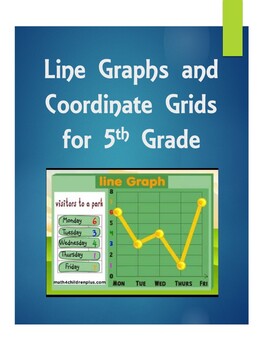
Line Graphs and Coordinate Grids for 5th Grade
Use this interactive Smart Notebook file to introduce your students to the vocabulary and parts of a coordinate grid. Activities include vocabulary review with dice, ideas for creating a line graph, plotting points on coordinate grids, and websites to use for practice in a whole group setting.
Grades:
5th - 6th
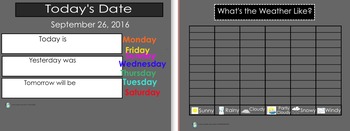
Interactive Morning Calendar
This smartboard calendar is a great way to include your students during calendar time.
This calendar includes:
- colors
- shapes (3d and flat)
- graphs (tracking the weather)
- song links (weather and days of the week)
- tens and ones
- tally marks
- tens frames
- counting by 5's and 10's
- counting to 10 by 1's
- counting to 20 by 1's
- counting to 50 by 1's
- representing numbers
- fact families
- days of the week (what was yesterday, today, and tomorrow)
- number bonds
- one more, one less
Subjects:
Grades:
PreK - 3rd
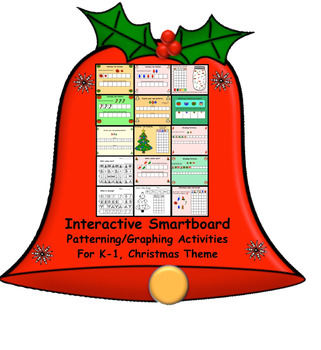
Interactive Smartboard Patterning/Graphing Activities for K-1 Christmas Theme
This is an Interactive Smart Notebook Product. You must have Smart Notebook Software to download this product. There are 15 pages in this product.
Pages 1-4 Students will follow the pattern by dragging shapes to tell "What comes next?"
Page 5 Students will have an opportunity to create their own patterns by dragging shapes onto the board.
Page 6-7 Students will work with "Growing Patterns". They will be asked to continue the pattern by dragging shapes onto the board.
Page 8 Students w
Subjects:
Grades:
K - 2nd
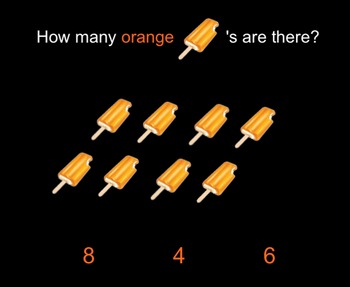
Identifying the Color Orange
This slideshow was designed to help students learn how to identify the color orange. It also has various math concepts such as counting using one-to-one correspondence, number identification and graphing. Example: Students will have to circle only the orange objects they see. Students will also have to count the orange objects and match them to the correct number.
Subjects:
Grades:
PreK - K
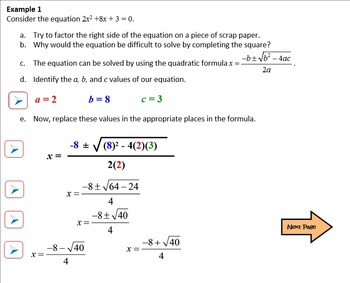
Write Equations for Graphed Lines
POWER POINT IS PASSIVE AND BORING!
Let your students come to the board and plot points with their fingers to determine the slope of a line.
This lesson contains two teaching examples to explain slope/intercept format and ten (10) practice problems for the interactive Smart Board. (Regular Ed and Students with Special Needs)
Printable student practice problems included.
Tried and Tested...my students love it!
Subjects:
Grades:
8th - 10th

How I Teach Proportional Relationships
This is a 29 page Smartboard lesson over Proportional Relationships. Students learn how to pick out proportional versus non proportional relationships by looking at graphs and by looking at x-y tables. I do not get into constant of variation and the use of a formula. I will save that for another lesson.
Subjects:
Grades:
6th - 9th, Staff

Using Models to Represent Ratios and Rates! SmartBoard Lesson / Scaffold Notes
In this SmartBoard lesson, students will learn how number lines, charts, tables and graphs can be used to represent unit rates, rates and ratios. Students will be given examples of how ratios are placed in tables/charts to see relationships and solve for unknowns. Students will see how double number lines are also used to represent rates and ratios. Lastly, students will see how line graphs, using x and y along with points can represent ratios and rates. There are examples of each for the class
Subjects:
Grades:
5th - 7th
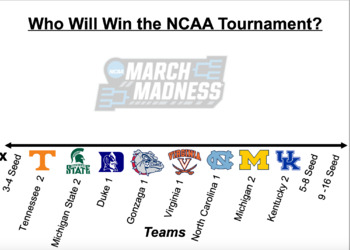
NCAA March Madness 2019 Smart Notebook Line Plot
This product is an interactive line plot using Smart Notebook software. You must have access to Smart Notebook and/or be able to access Smart Notebook Express online in order to utilize this product!Students can use this line plot to vote on the team they think is going to win the NCAA tournament! You can use this product to discuss probability and also to reinforce the skill of line plotting.
Subjects:
Grades:
Not Grade Specific
Scatter Plot and Slope Foldable
A foldable that shows the similarities of slope and Scatter Plots.
Grades:
6th - 12th
Types:

Table of Values
In this lesson, students will learn how to graph anything using a table of values. The lesson begins with an example, then goes through an activity where pairs will graph all of the functions learned in PreCalculus 30. Students will then take part in assessing the answers with the graphs provided in the document. This is how I start my PreCalculus courses every year, and it is very helpful.This lesson is also available as a PowerPoint.Enjoy!
Subjects:
Grades:
10th - 12th
Also included in: PRECALCULUS 30 BUNDLE - ALL OF IT!
Showing 1-24 of 61 results


