26 results
5th grade graphing Common Core 7.SP.A.2 resources
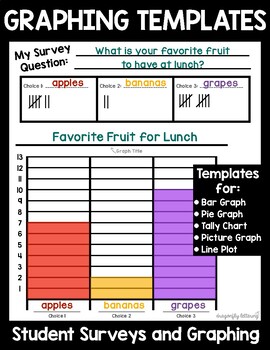
Graphs & Survey Templates - Conduct a Survey, Create Graphs, Analyze Data
Graphing and Survey TemplatesAligns with K-5 CCSS for Measurement and DataThese worksheets can be used YEAR ROUND! Students love giving surveys and gathering information from their classmates. Graphing and analyzing data is an important skill that develops across grade levels.This file includes:2 Introductory Bar Graph Surveys4 Bar Graph TemplatesA blank template to use for Line Plots, Picture Graphs, Bar Graphs, etc.4 Tally Graph Templates1 Pie Chart TemplateGraphing QuestionsEach graphing temp
Grades:
K - 8th
Types:
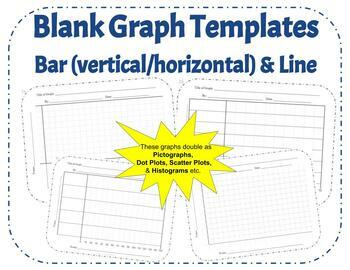
42 Blank Graph Templates: Horizontal & Vertical Bar Graph, Line Graph, Printable
Looking for an array of printable graph templates for all your future bar and line graph needs? Look no further! With 42 different templates ranging for bar graphs, to line graphs, varying in X values and Y values, this combination should be the last graph download you need to worry about for your class. These graphs can even be used as Histograms, Dot Plots, Scatter Plots, or a variety of other graphs to suit the needs of your classroom.I created this template to require all the basics of gr
Grades:
4th - 12th
Types:
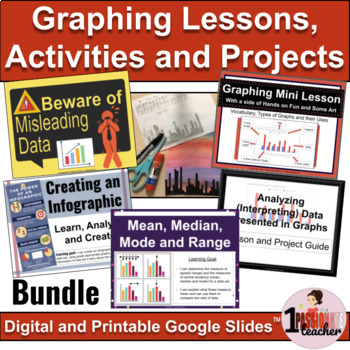
Data Management Ontario | Graphing | Data Literacy Bundle
Data collection, graphing vocabulary, types of graphs, inferring data, creating digital graphs, analyzing misleading graphs, infographics, measures of central tendency...this is what your students will learn and more, with this interactive graphing lessons and activities mega bundle. Save 20% with this multi-curricular bundle (math, writing and art); Everything you need for Graphing in your in-person, distance learning or hybrid Ontario math classroom (New Ontario Math Curriculum)! Check out my
Subjects:
Grades:
5th - 6th
Types:
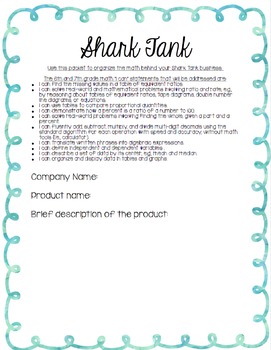
Shark Tank Project
Based on the hit show Shark Tank, students will create a product and business plan to pitch to the "Sharks". This product comes complete with the student packet, certificate for students, questions/script for the sharks, and teacher hints for how to make this a hit!All tasks within the project are connected to 6th and 7th grade CCSS math standards. "I Can" statements are provided in the student packet.Students will:-Create a company name and product-Determine the cost per product to make-Determi
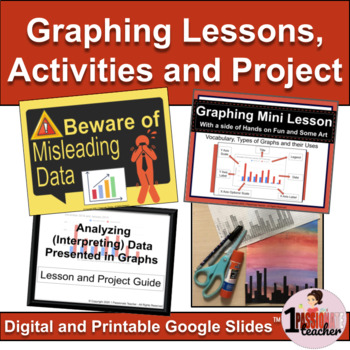
Data Management Ontario | Graphing | Lesson with Activities and Project Bundle
Data collection, graphing vocabulary, types of graphs, inferring data, creating digital graphs, analyzing misleading graphs...this is what your students will learn and more, with this interactive graphing lessons and activities mega bundle. This multi-curricular bundle (math, writing and art) is everything you need for your in-class or distance learning Ontario math classroom! Check out the growing bundle that includes infographics and measures of central tendency.Also included in my entire col
Subjects:
Grades:
5th - 6th
Types:
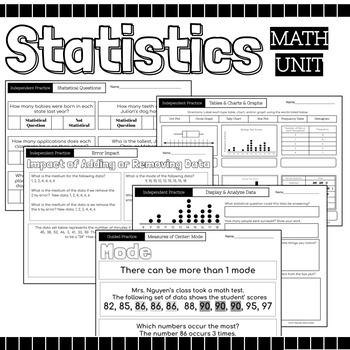
Statistics Math Packet {Data, Charts, Graphs, Mean, Median, Mode, Range, Spread}
52 Page Statics Unit Includes: Guided Instruction & Independent Practice Pages Usage Suggestions and IdeasThis resource can be utilized in numerous ways, here are some ideas:use for guided practiceassign as partner workassign as independent practicecan be used for morning workuse for reteaching in small group settinguse as review prior to assessmentuse as review in continuing to strengthen skillassign for homeworkuse as independent work during math centersTopicsRecognize Statistical Question
Subjects:
Grades:
4th - 12th
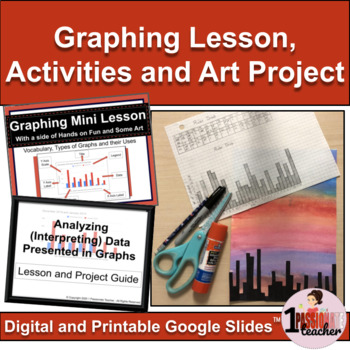
Data Management Ontario | Graphing | Lesson with Activities and Project Bundle
Start your graphing unit off with a bang...or rather a "drop." Begin with the digital mini lesson that reviews data management vocabulary, parts of a graph and different types of graphs. Then give your students some hands-on fun, with a ruler "drop" data collection activity and art project. Now it's deep thinking time! Students will learn about inferring data and creating digital graphs using Google sheets, then will complete a data management and writing process project that will deepen their u
Subjects:
Grades:
5th - 8th
Types:
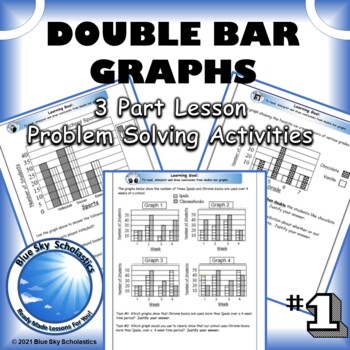
Double Bar Graphs Problem Solving Activities (Read, interpret, draw conclusions)
Students practice reading, interpreting and drawing conclusions from multiple bar graphs that compare two different populations. They also compare various graphs and determine which one is the most persuasive. This 3 part lesson has your students apply their problem solving skills while practicing analyzing sets of data represented in double bar graphs. Ontario Math Curriculum Expectations:D1.6 analyse different sets of data presented in various ways, including in histograms and broken-line gr
Subjects:
Grades:
4th - 7th
Types:
Also included in: Double Bar Graphs - Bundle - Grade 5 New Ontario Curriculum
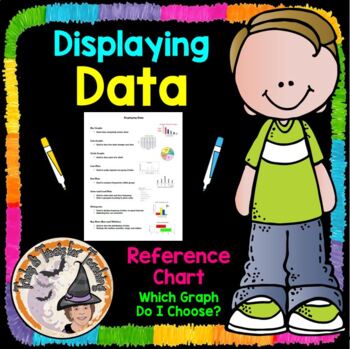
Displaying Data Reference Chart Notes Which Graph Do I Choose?
Math Teachers ~ You'll LOVE this Displaying-Data, Which-Graph-Do-I-Choose? Data-Display Reference-Chart will be SUPER helpful to your students in helping them determine which graph to choose, and provides a quick visual picture to remind them what that particular graph looks like. I printed one of these for each of my students to put inside their Math Toolkit Notebook, to use as a Reference for Data Displays Charts and Graphs. You'll enjoy using this year after year!Be sure to L@@K at my other 1
Subjects:
Grades:
5th - 8th
Find the Error - Data and Graphs with Central Tendency and Variation
This is an activity that I created for my students to find the mistake when a student has answered questions from graphs about measures of center and variation incorrectly. I used common errors to help them see the mistakes commonly made. All of my products are common core aligned.I had the students work alone to solve the problems first, and then share with their groups. If there was any discrepancy, they looked in the answer folder on their tables to see the correct answer. I rotated around
Subjects:
Grades:
5th - 7th
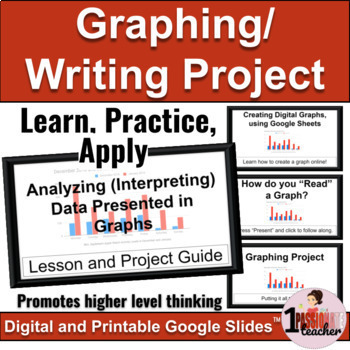
Analyzing Data | Digital | Graphing and Persuasive Writing Project
This Data Management graphing and writing project helps your students to dig deeper into the importance of data. Create digital graphs with Google Sheets, analyze them for deeper understanding and tie it all together with a meaningful persuasive letter. Great real-world learning for your classroom!Start your unit off with a bang...or rather a drop AND save yourself time and money, with this no-prep Data Management set here! (includes misleading data!). Or better yet, save 20% off with this FULL
Subjects:
Grades:
5th - 8th
Bottle Flipping: Math in Motion
As long as the students are going to flip bottles, let’s find the math in it. This measurement, data, and technology activity will keep the students so engaged that they’ll forget that they are learning rigorous math!As a “S.T.E.M. in Action” lesson, you’ll find all four components of a true S.T.E.M. curriculum represented.Science — Students measure mass and compare the behavior of the liquids as they flip the bottle.Technology — Students can build a spreadsheet and use it to collect and aggrega
Subjects:
Grades:
5th - 8th
Types:
NGSS:
MS-ETS1-4
, 3-5-ETS1-1
6 Editable Bar Graph Templates 2.0
Finally a simple and professional graph space that students can fill out without any design issues getting in the way. This file contains 6 ready-to-use graph options. Print them and have students fill them with pencil and ruler, or distribute them over computer and let them practice entering the data. Get a project perfect finish every time. Maybe you just want to fill it out live on a projector? The possibilities are endless! It's okay to say you love these bar graphs. So do we.Contains:- 2 bl
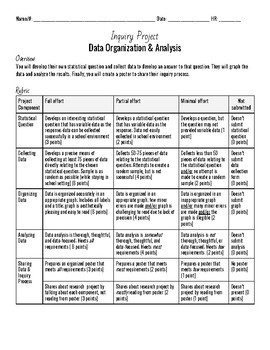
Inquiry Project: Data Organization & Analysis
This assignment can be used in many ways to allow students to engage in the inquiry process while practicing valuable statistics skills.
Promotes Curiosity & Critical Thinking:
In today’s digital world, curiosity is a lost art form; if we have a question, we simply ask Google. There’s no need to think deeply or wonder about the world, because many answers are already online! This project helps students practice the curiosity that is critical for the inquiry process by engaging them in ques
Subjects:
Grades:
4th - 12th
Types:
One Fish, Two Fish, Red Fish, Blue Fish - complete a random sample
If you need to know how many sharks are in the ocean, do you count every single shark? You use random sampling! Random sampling is often a difficult lesson to teach in math. This is a great hands -on lesson to introduce the concept of sampling. There are so many other activities you can do with this book including graphing,creating fish in art, etc...
The journal prompts relate the activity to other populations that use sampling for estimating totals.
Before completing the activity, you wi
Subjects:
Grades:
4th - 7th
Types:
CCSS:
Also included in: Cross-Curricular: Reading in the Math Classroom Bundle of 10
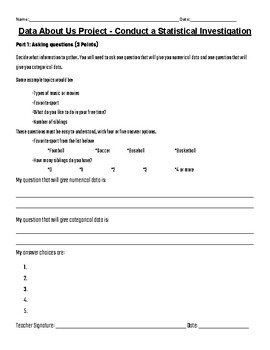
Data Project - Conducting a Statistical Analysis
This data project was created to use at the end of the Connected Math Unit "Data About Us" but it can be used at the culmination of any 5th, 6th, or 7th-grade data unit. It can also be used at any grade level as an enrichment activity or to review statistical data.
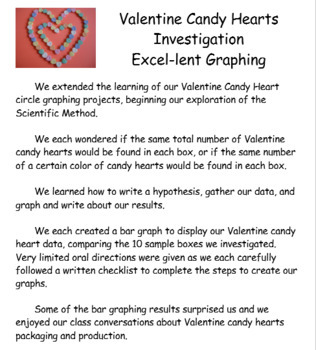
Excel Graphing Valentine Candy Hearts Investigation
#welovecandyheartsThis integrated Math/ Science/ Technology project is a great way to make statistics and probability real, relevant, fun, and delicious!Students will create bar graphs using Excel to display Valentine candy hearts data, as students consider packaging and production of small Valentine candy heart individual boxes. Project file includes sample bulletin board display poster, project directions in individual student checklist form, and rubric to grade the finished graph.Project file
Grades:
5th - 7th
Types:
NGSS:
3-5-ETS1-2
, MS-ETS1-3
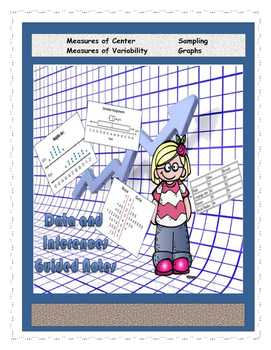
Data, Graphing, and Sampling Interactive Notes
I use this as interactive notes with my students. Included in the notes are vocabulary, examples, dot plots, box plots, histograms, stem and leaf plots, measures of center, measures of variation, population, and sampling.
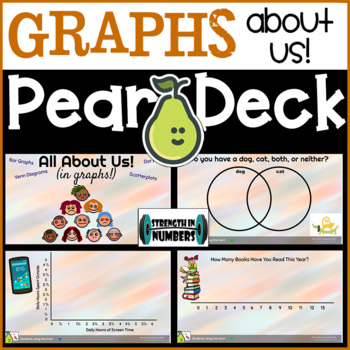
All About Us GRAPHS Digital Activity for Google Slides/Pear Deck
This product includes a digital Google Slides presentation with a PearDeck add-on. Works great with in-person or distance learning. Watch students work in real time and share answers with the class without showing names. The slides can be used alone for a class presentation but are meant to be used with the Pear Deck add-on. Simply open the slides, make a copy, go to Add-ons → Pear Deck and then click the green “start lesson” button on the right hand side where the Pear Deck options pop up.
Subjects:
Grades:
5th - 10th
Also included in: 6th Grade Math 6 Complete Year BUNDLE 25 Google Slides/Pear Deck
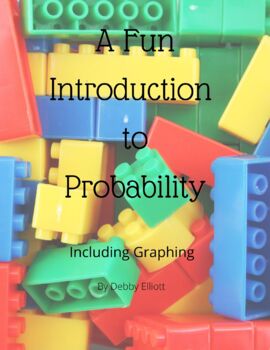
A Fun Introduction to Probability
This product contains fourteen pages that introduce probability by graphing the LEGOs and comparing the number of studs on LEGO bricks. These statistics will be figured in fractions, decimals and percentages. Graphing will be done on bar graphs and pie graphs. The worksheets are colorful and engaging for students. Students will learn to find the mean, median and mode of different numbers of studs on LEGO bricks. Students will find their own statistics and combine them with the statistics of ot
Subjects:
Grades:
4th - 9th
Probability of Independent Events Using Sample Space Smartboard Slides Lesson
Probability-of-Independent-Events-Using-Sample-Space Smartboard-Lesson has lots of interactive practice for your students. 23 slides in all! Great graphics and problems! Your students will LOVE this lesson! You'll use it year after year! WARNING: You MUST have SMART Technologies SMART software, and a SMARTBOARD to teach from, to effectively download, open and use this Interactive Smartboard Lesson. Go to https://legacy.smarttech.com/en/products/education-software/smart-learning-suite/download/tr
Subjects:
Grades:
5th - 8th, Staff

Product Design Math Project
Let your students delve into the real world application of percents, statistics, and graphing.
They will choose one of three company focuses that need a new product. Students will create questions to survey classmates or schoolmates in order to guide their design.
They will categorize that data and create various graphs, percentage statements, and a presentation.
All of these steps are followed through the steps of design thinking.

Displaying Data Clearly Worksheet
This worksheet begins with suggestions for reinforcement or enrichment with regards to data. There are 4 problems in which students need to organize data in a table, display it in either a dot plot, histogram, or box plot, and then determine the mean, median, mode, and range for the data. There is an answer key for the first 2 problems but the last two problems involve students creating their own data using dice and cards.
Subjects:
Grades:
5th - 8th

Math Test Review/Prep Problems/Starters Grade 5 - 10
This Playlist of short videos are taken from released State End of the Year assessments for Grades 5, 6, 7, 8, 9 and 10. These problems check for understanding relative to what every student should know and be able to do. Each video is ONE question from a Common Core Aligned State Assessment. Each question is read and a modeled exemplar solution follows. Studies are showing that video instruction provides a more engaging sensory experience than print resources, an increase of knowledge rete
Showing 1-24 of 26 results


