15 results
5th grade applied math Common Core 7.SP.A.2 resources
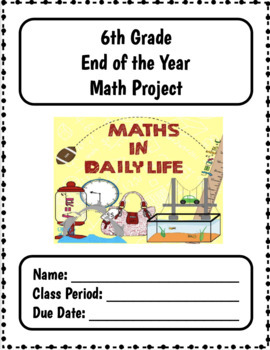
6th Grade MATH End of Year Summative Project + Distance Learning
Please see my 7th Grade Math End of Year Summative Project (Over 100 Sold) 7th Grade Bell Ringers (Discounted)Geometric Dream House Project! Over 500 sold! *This is a GREAT tool for Summer School as it touches all standards as well**After Testing is finished, your students don't want to work on worksheets or regular skill and drill. Instead, they want to be empowered with the opportunity to apply their knowledge in the real world with a fun and engaging multi-day project! This is a 10 part proj
Subjects:
Grades:
5th - 7th
Types:
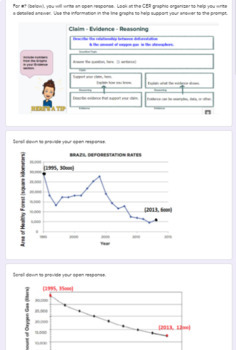
Data Analysis: Deforestation & Oxygen Gas Human Impact CER Open Response
Students identify the pattern between deforestation (decreasing area of forest) & decreasing amount of oxygen gas in the air. Using line graphs, students are guided in describing the relationship between two data sets to describe the negative human impact on ecosystems. A claim - evidence- reasoning (CER) graphic organizer is provided to guide students' writing. Encouraged to incorporate evidence, students are also prompted to think about the importance of each element of the CER writing too
Complete Lesson Collection - 62 Lessons 298 pages
Every lesson that Make Math More has ever created in one GIANT PDF download! 62 lessons and 298 Pages worth of real-life, engaging math activities. That makes it only $0.75 per lesson. Lesson Plans and Student Guides are included for every lesson. Most Common Core standards are covered in grades 6-8 (see contents below), but teachers have adapted and used my lessons well beyond these grade levels. See the full list below and enjoy the lessons!Candy Split - Students will use candy to explore what
Subjects:
Grades:
4th - 10th
Types:
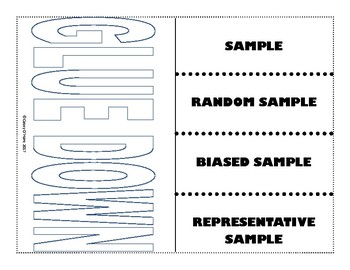
Sampling Foldable
TEKS 8.11 CFoldable that covers what a sample is, population size, random samples, biased samples, and representative samples. Includes examples of each.*Cut on dotted line only*
Subjects:
Grades:
5th - 8th
Mean, Median, Mode, Range Smartboard Slides Lesson Measures of Central Tendency
You'll LOVE this great Data Measures-of-Central-Tendency: Mean, Median, Mode, & Range Smartboard-Slides-Lesson. Your students will LOVE this interactive smartboard lesson that teaches and practices Mean, Median, Mode, and Range, along with a Card Game for practice. YOU GET 28 slides total, a very comprehensive and complete lesson. You'll enjoy using this great smartboard lesson year after year. WARNING: You MUST have SMART Technologies SMART software, and a SMARTBOARD to teach from, to effec
Subjects:
Grades:
4th - 7th
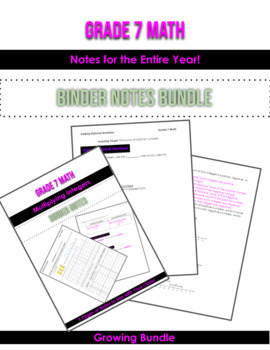
Grade 7 Math - Binder Notes Bundle - GROWING COLLECTION
This is a bundle of binder notes created for a math class that uses a binder all year long.A growing bundle means that once purchased, all updates and additions to this bundle can be downloaded for free. As the bundle grows, the price will increase - so the earlier the purchase is made, the more you will benefit from the resources included.Currently included:- Rational Numbers- Adding Integers- Adding Rational Numbers- Subtracting Integers- Subtracting Rational Numbers- Multiplying Integers- Div
Subjects:
Grades:
5th - 8th
Plan A Vacation Simulation (Financial Literacy for Secondary)
This project tasks students with creating a week-long dream vacation using a budget of $2,000 per person. They will be tasked to plan out accommodations and document them on a budget sheet. Lastly, They will create a slideshow presentation!
Subjects:
Grades:
5th - 9th
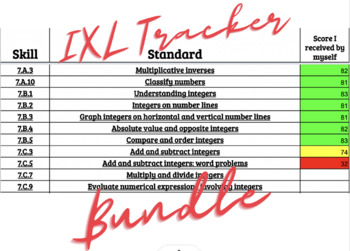
3rd-8th Grade IXL Math Digitial Trackers
Do you teach only one grade but have a classroom full of students who academically perform on different grade levels? Do you want to make sure you target the multiple skills each of those students need?Purchase the bundle and assign (via Google Classroom) a document to each student based on their performance level! It's as simple as that!Students will become independent and strong mathematicians. SIt back and watch them grow!
Subjects:
Grades:
3rd - 8th
Types:
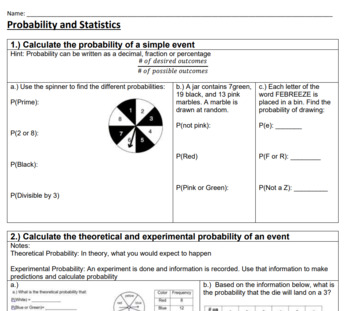
7th grade Probability and Statistics Study Guide Test Prep Worksheet
This is the study guide that I use to prepare students (7th grade) for the Chapter Test on Geometry. This contains great topics to prepare student for finding measures of central tendency and variation and finding probability and making predictions. Here are the topics that is covered on the study guide:Probability of a simple eventExperimental Probability and Theoretical ProbabilityPopulation and SampleCentral Tendency (Mean, median, mode)Variation (Range, interquartile range) Effects and an o
Subjects:
Grades:
5th - 10th
Types:
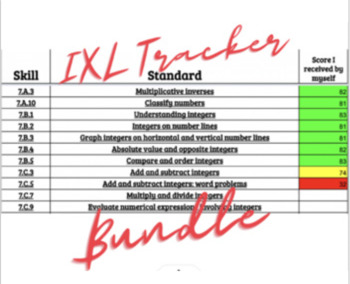
Elementary (3-5) Grade IXL Math Digitial Trackers
Do you teach only one grade but have a classroom full of students who academically perform on different grade levels? Do you want to make sure you target the multiple skills each of those students need?Purchase the bundle and assign (via Google Classroom) a document to each student based on their performance level! It's as simple as that!Students will become independent and strong mathematicians. SIt back and watch them grow!
Subjects:
Grades:
3rd - 5th
Types:
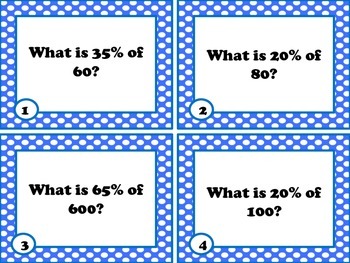
Percent Task Cards
Taskcards are a great way to give students extra practice. Download this PDF of 3 sets of 24 task cards with various types of percent problems. These Common Core based task cards come in three bordered sets leveled as easy(polka dot border), medium (striped border) and hard (stars border). These cards are perfect for classroom differentiation or if you teach multiple grade levels. There are 24 cards in each set complete with an answer key for each. It also comes with 3 types of answer sheets: 3
Subjects:
Grades:
5th - 8th
Types:
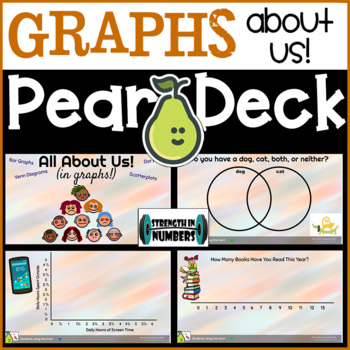
All About Us GRAPHS Digital Activity for Google Slides/Pear Deck
This product includes a digital Google Slides presentation with a PearDeck add-on. Works great with in-person or distance learning. Watch students work in real time and share answers with the class without showing names. The slides can be used alone for a class presentation but are meant to be used with the Pear Deck add-on. Simply open the slides, make a copy, go to Add-ons → Pear Deck and then click the green “start lesson” button on the right hand side where the Pear Deck options pop up.
Subjects:
Grades:
5th - 10th
Also included in: 6th Grade Math 6 Complete Year BUNDLE 25 Google Slides/Pear Deck
Mean Finding the Average Central Tendency MEAN Smartboard Slides Lesson Data
Math Teachers ~ You'll LOVE this TERRIFIC MEAN, Finding-the-Average, Central-Tendency, Smartboard-Slides-Lesson that has 24 slides total and includes modeling as well as word problems. Students will love this interactive lesson ~ where they actively participate in solving for the MEAN (average). WARNING: You MUST have SMART Technologies SMART software, and a SMARTBOARD to teach from, to effectively download, open and use this Interactive Smartboard Lesson. Go to https://legacy.smarttech.com/en/p
Subjects:
Grades:
4th - 7th, Staff
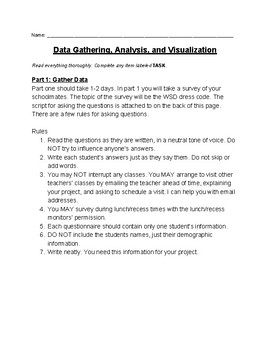
Dress Code Data Analysis and Visualization
If your school has a dress code, use this Project Based Learning packet to teach your students about gathering, analyzing, and visualizing authentic data. The packet covers calculating percentages, measures of central tendency (mean, median, mode) and range, analyzing multiple data sets in conjunction to determine correlations, and visualizing data for improved analysis and communication. The packet is written to be mostly self guided. It is great as an enrichment project or as a whole class pro
Subjects:
Grades:
5th - 9th
Types:
CCSS:
Mean, Median, Mode, and Range Video Notes
Check out this funny and engaging video on mean, median, mode, and range! It teaches the basics of data while giving students a little laugh. This worksheet contains a link to the video, definitions, examples, and practice problems. The answers to the practice problems are at the very end of the video. This is a fun resource for independent practice, lesson hook, review, sub day, or homework! https://youtu.be/tD0LtelkJJ4Preview this video and check out our others on YouTube! Our resources are fr
Subjects:
Grades:
5th - 8th
Showing 1-15 of 15 results


