5 results
5th grade basic operations Common Core 7.SP.A.2 resources
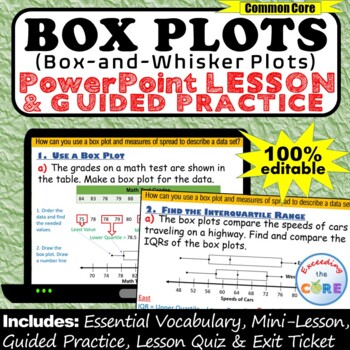
BOX PLOTS (Box-and-Whisker Plots) PowerPoint Lesson AND Guided Practice DIGITAL
Great for online learning and distance learning!Get your students successfully creating and using BOX PLOTS (Box-and-Whisker Plots) with this PowerPoint Presentation. This lesson begins with a focused mini-lesson and guided practice questions. It concludes with a lesson quiz and exit ticket to assess student understanding. All of the answers are included. This PowerPoint presentation is 100% editable, therefore you can modify any slide as needed.What is Included:_ Mini-Lesson with Guided Practi
Subjects:
Grades:
5th - 7th
Median Mode Range Smartboard Slides Lesson Measures of Central Tendency
Incredible ~ 31 slides ~ Smartboard-Slides-Math-Lesson over Median, Mode, and Range (Measures of Central Tendency). This is EVERYTHING you need to teach these three measure-of-central-tendencies. Students will enjoy the interactive slides where they work problems at the Smartboard. Please be sure to see my other smartboard lesson on Finding the Mean, Average. You'll enjoy using this resource year after year. WARNING: You MUST have SMART Technologies SMART software, and a SMARTBOARD to teach from
Subjects:
Grades:
4th - 7th, Staff
Mean Finding the Average Central Tendency MEAN Smartboard Slides Lesson Data
Math Teachers ~ You'll LOVE this TERRIFIC MEAN, Finding-the-Average, Central-Tendency, Smartboard-Slides-Lesson that has 24 slides total and includes modeling as well as word problems. Students will love this interactive lesson ~ where they actively participate in solving for the MEAN (average). WARNING: You MUST have SMART Technologies SMART software, and a SMARTBOARD to teach from, to effectively download, open and use this Interactive Smartboard Lesson. Go to https://legacy.smarttech.com/en/p
Subjects:
Grades:
4th - 7th, Staff

Displaying Data Clearly Worksheet
This worksheet begins with suggestions for reinforcement or enrichment with regards to data. There are 4 problems in which students need to organize data in a table, display it in either a dot plot, histogram, or box plot, and then determine the mean, median, mode, and range for the data. There is an answer key for the first 2 problems but the last two problems involve students creating their own data using dice and cards.
Subjects:
Grades:
5th - 8th
Showing 1-5 of 5 results


