TPT
Total:
$0.00

Excel Graphing Valentine Candy Hearts Investigation

;
Caryn Dingman
120 Followers
Grade Levels
5th - 7th, Homeschool
Resource Type
Standards
Formats Included
  • PDF
  • Excel Spreadsheets
Pages
7 pages
$2.25
$2.25
Share this resource
Report this resource to TPT
Caryn Dingman
120 Followers

Description

#welovecandyhearts

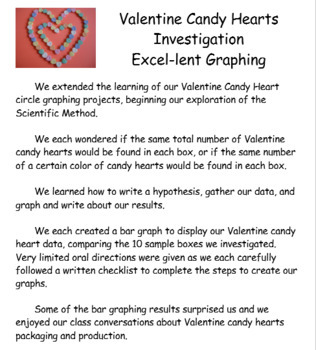
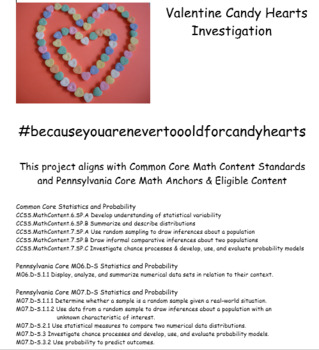
This integrated Math/ Science/ Technology project is a great way to make statistics and probability real, relevant, fun, and delicious!

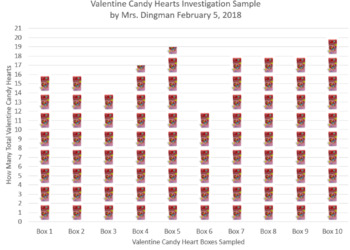
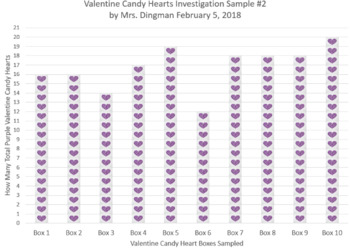
Students will create bar graphs using Excel to display Valentine candy hearts data, as students consider packaging and production of small Valentine candy heart individual boxes.

Project file includes sample bulletin board display poster, project directions in individual student checklist form, and rubric to grade the finished graph.

Project file student directions have been updated for Excel 2016.

Completed graphs could be inserted into a Scientific Method Mini-Trifold Board, using a Word doc I developed. This is available as a FREE resource in my teacherspayteachers shop. Student samples of this may be viewed here:

http://www.mrsdingman.com/Vday_Mini_Tri-Fold_Julia.pdf

http://www.mrsdingman.com/Vday_Mini_Trifold_Natalie.pdf

This Excel graphing project was completed in my math classroom as a "center" activity. Small groups of students worked on our 5 classroom desktop computers, had rotating 10-15 minute sessions, allowing all students to work at their own pace. During a 9 week marking period, we completed one or two graphing projects, using this center-based approach.

Student samples of this classroom-tested project may be viewed on my web site here:

http://www.mrsdingman.com/ExcelGraphing.html#anchor_244

Total Pages
7 pages
Answer Key
N/A
Teaching Duration
N/A
Report this resource to TPT
Reported resources will be reviewed by our team. Report this resource to let us know if this resource violates TPT’s content guidelines.

Standards

to see state-specific standards (only available in the US).
Recognize a statistical question as one that anticipates variability in the data related to the question and accounts for it in the answers. For example, “How old am I?” is not a statistical question, but “How old are the students in my school?” is a statistical question because one anticipates variability in students’ ages.
Understand that a set of data collected to answer a statistical question has a distribution which can be described by its center, spread, and overall shape.
Recognize that a measure of center for a numerical data set summarizes all of its values with a single number, while a measure of variation describes how its values vary with a single number.
Reporting the number of observations.
Understand that statistics can be used to gain information about a population by examining a sample of the population; generalizations about a population from a sample are valid only if the sample is representative of that population. Understand that random sampling tends to produce representative samples and support valid inferences.

Reviews

Questions & Answers

120 Followers