Statistics Math Packet {Data, Charts, Graphs, Mean, Median, Mode, Range, Spread}
Enhance SEL
568 Followers
Grade Levels
4th - 12th
Subjects
Resource Type
Standards
CCSS6.SP.A.1
CCSS6.SP.A.2
CCSS6.SP.A.3
CCSS6.SP.B.4
CCSS6.SP.B.5
Formats Included
- PDF
Pages
52 pages
Enhance SEL
568 Followers
Description
52 Page Statics Unit
Includes: Guided Instruction & Independent Practice Pages
Usage Suggestions and Ideas
This resource can be utilized in numerous ways, here are some ideas:
- use for guided practice
- assign as partner work
- assign as independent practice
- can be used for morning work
- use for reteaching in small group setting
- use as review prior to assessment
- use as review in continuing to strengthen skill
- assign for homework
- use as independent work during math centers
Topics
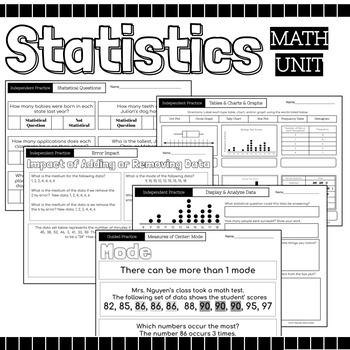
- Recognize Statistical Questions- students decide if the posed question is statistical or not statistical and then explain why
- Students brainstorm and type their own statistical question and explain why it is statistical as well as a questions that is not statistical
- Students will evaluate Tally Chart, Frequency Table, Dot Plot, Histogram, Box Plot, Circle Graph and determine which one is which
- Students will learn about the shape of distribution. There are guided practice pages for each of the following, followed by 4 independent practice pages in which the students determine if the given graph displays the given shape of distribution (cluster, gap, peak, symmetry, skewed lift, skewed right, outlier)
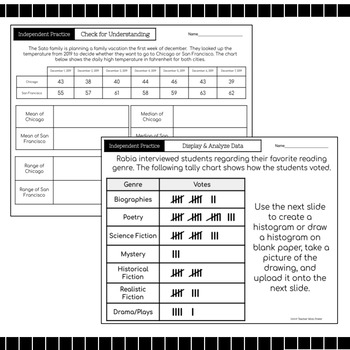
- Students will calculate the measure of center: mean, median, mode, and mean absolute deviation- M.A.D.
- Students will find the measures of variation: range, lower quartile, upper quartile, interquartile range of given data
- Students will determine the center and spread of given data
- Students will display and represent data by creating dot plots or histograms
- Students will analyze data to answer questions
Total Pages
52 pages
Answer Key
Does not apply
Teaching Duration
N/A
Report this resource to TPT
Reported resources will be reviewed by our team. Report this resource to let us know if this resource violates TPT’s content guidelines.
Standards
to see state-specific standards (only available in the US).
CCSS6.SP.A.1
Recognize a statistical question as one that anticipates variability in the data related to the question and accounts for it in the answers. For example, “How old am I?” is not a statistical question, but “How old are the students in my school?” is a statistical question because one anticipates variability in students’ ages.
CCSS6.SP.A.2
Understand that a set of data collected to answer a statistical question has a distribution which can be described by its center, spread, and overall shape.
CCSS6.SP.A.3
Recognize that a measure of center for a numerical data set summarizes all of its values with a single number, while a measure of variation describes how its values vary with a single number.
CCSS6.SP.B.4
Display numerical data in plots on a number line, including dot plots, histograms, and box plots.
CCSS6.SP.B.5
Summarize numerical data sets in relation to their context, such as by:


