10 results
Higher education graphing simulations
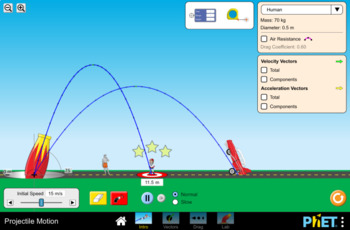
Projectile Motion Simulation Lab- PhET
This handout is meant to accompany the Projectile Motion simulation found here: https://phet.colorado.edu/en/simulation/projectile-motion
45 minute lesson time
This lab can be used to teach a range of concepts such as:
-Relationships between independent/manipulated and dependent/responding variables
-Forces in motion
-Projectile Motion
-The relationship between firing angle and distance traveled
-Graphing independent/ dependent variables
-Creating data tables
Subjects:
Grades:
6th - 12th, Higher Education, Adult Education
Types:
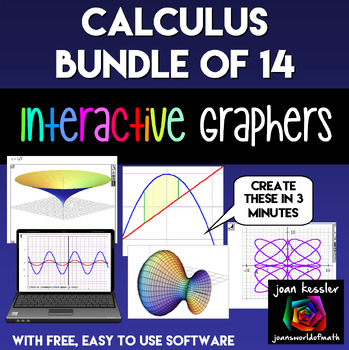
Calculus Bundle of Interactive Graphing Apps plus software
Your Calculus students will love these interactive simulations and demonstrations of graphical calculus. These Dynamic moving 3D graphs will help your Calculus students visualize the concepts you teach. Engaging and so easy to use, you will be demonstrating important concepts in AP Calculus AB, BC, Honors or traditional Calculus 1 and 2 in minutes. Project from your computer onto a screen or whiteboard. No internet needed.There are 14 Applets Included: ✓ Animated End Behavior ✓ Animated Functio
Grades:
11th - 12th, Higher Education
Types:
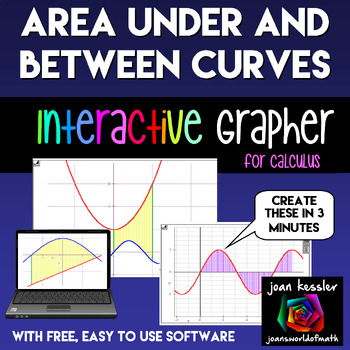
Calculus Area Under Curves Interactive Graphing Tool
Your Calculus students will love these interactive simulations and demonstrations of the Area Between Curves and the Area Under a Curve! These Dynamic moving 3-d graphs will help them visualize the concepts you teach. Engaging and so easy to use, you will be demonstrating important concepts in AP Calculus AB, BC, Honors or traditional Calculus 1 and 2 in minutes. Project from your computer onto a screen or whiteboard.Wow your Calculus students with interactive math explorations. Explore the a
Grades:
10th - 12th, Higher Education
Types:
Simulation Classroom Economy Lesson Plan
This lesson plan is for a fifth or possible sixth grade economics unit. The lesson is specially designed to be a part of an economics unit which requires or needs a simulation. The lesson plan includes critical questions, currency template, simulation record sheet and step-by-step instructions on how to set up your classroom. This lesson plan will make your classroom economy simulation meaningful, integrated, value based, challenging and active (MIVCA).
Subjects:
Grades:
4th - 12th, Higher Education
Types:
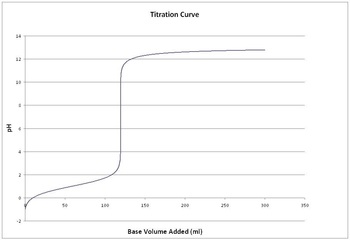
Simulating Titration of Acid on a Spreadsheet
This activity guides students to construct a spreadsheet from a blank Excel workbook that will simulate titration of acids or bases.
*Teacher background on Excel is not required*
After constructing the spreadsheet and graphs the students will experiment with the spreadsheet to answer analysis questions that will help students learn the mathematical nature of titration (solutions are provided including descriptions of all spreadsheet manipulations necessary to solve each problem).
The va
Subjects:
Grades:
10th - 12th, Higher Education
Types:
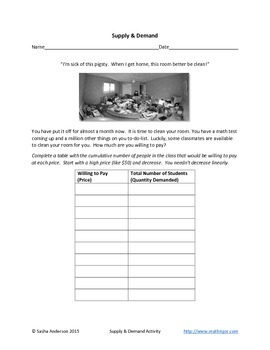
Supply and demand
A classroom activity where student build their own demand and supply curves based on what they are willing to pay (or be paid) for a clean room. Students must reason quantitatively and use units common in economics to solve problems in market equilibrium. Algebra- linear equations, systems of equations, and functions.
Subjects:
Grades:
9th - 12th, Higher Education, Adult Education
Types:
CCSS:
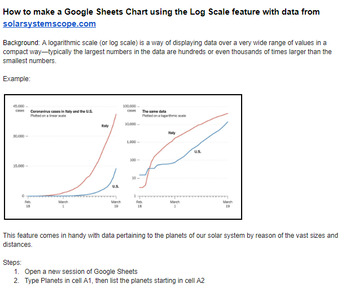
Google Sheets Chart using Log Scale feature with data from solarsystemscope.com
Instructions on how to make a Google Sheets Chart using the Log Scale feature with data from solarsystemscope.com
Subjects:
Grades:
5th - 12th, Higher Education, Adult Education
Types:
HALF-LIFE SIMULTION
Most people think of half-life in terms of radioaictve decay. However, it can also refer to drug interactions, pesticides in plants and a plasma half-‐life which is a stability factor. In each case the mathematical equations are similar and produce the typical half-life curve. Using M&Ms to create a simulation of the half-‐life process students create a graph with an exponential curve.
Subjects:
Grades:
7th - 12th, Higher Education
Types:
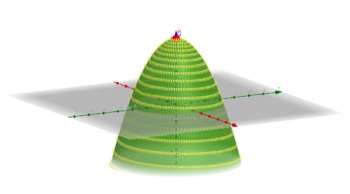
Three Dimensional Curves and Surfaces. 3D - Geometria Analitica
Use GeoGebra' tools for well understanding parametric equations and three dimensional analytic geometry ParaboloideIn mathematics, a parametric equation defines a group of quantities as functions of one or more independent variables called parameters. Parametric equations are commonly used to express the coordinates of the points that make up a geometric object such as a curve or surface, in which case the equations are collectively called a parametric representation or parameterization (alterna
Subjects:
Grades:
10th - 12th, Higher Education
Types:

Terminal Velocity Simulation Written on a Spreadsheet
EXPAND THE USE OF SPREADSHEETS IN YOUR PHYSICS CURRICULUM... This Physics activity good for all levels of Physics is a free preview of "The Spreadsheet Lab Manual." It guides students to construct a mathematical simulation starting from a blank spreadsheet that quantitatively models freefall with air resistance as an object reaches terminal velocity. Students will be guided through an inquiry based simulation as they answer assessment questions and gain skills on spreadsheets while manipulati
Subjects:
Grades:
9th - 12th, Higher Education, Adult Education, Staff
Types:
Showing 1-10 of 10 results


