284 results
Higher education graphing worksheets
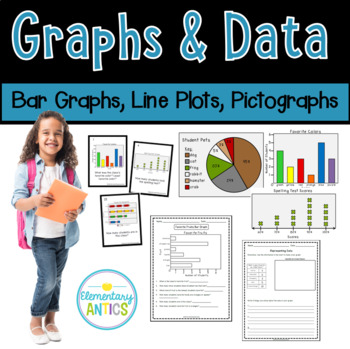
Graphs and Data- Bar Graphs, Line Plots, Pictographs
This graphs & data file features a variety of resources for practicing reading graphs and representing data using bar graphs, line plots, and pictographs. The Common Core Standards covered include 2.MD.D.10. There are 5 worksheets with various graphs and questions where students solve simple put-together, take-apart, and compare problems using information presented in the graphs.There are also 2 activities where students will use data presented in a chart to make their own bar graph and li
Subjects:
Grades:
1st - 3rd, Higher Education
Types:
ACT Math Test Prep for Algebra Geometry Number Sense
This ACT math resource has 26 questions covering the following topics: functions, algebraic and geometric transformations, graphing, exponent rules, slope, midpoint, quadratic formula, geometric sequences and more! The answer key comes with explanations for each problem! Standards are included so student can determine weaknesses. If you want a combination of SAT, PSAT, ACT and ACCUPLACER and TSI, then check out the Mega Bundle below:COLLEGE TEST PREP MEGA BUNDLE - 3 BUNDLES IN ONE!Copyright © Ti
Grades:
9th - 12th, Higher Education, Adult Education
Types:
Also included in: ACT Math Test Prep Bundle
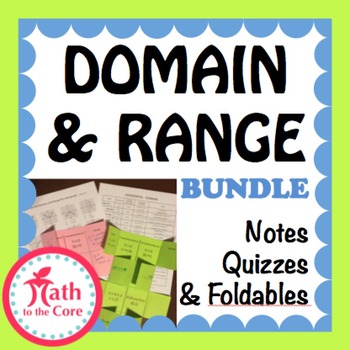
Domain and Range of a Graph Bundle
Domain and Range of a Graph Notes, Homework, and Quiz Bundle
with inequality, interval, and set builder notation
This will stop all confusion of Domain and Range Notation!!!
My students find the chart invaluable especially the Vertical Graph depictions.
Included in this package
1. Complete Chart for Domain and Range Notation
2. Complete Chart for Domain Notation
3. Complete Chart for Range Notation
4. Foldable Template
5. Quiz 1 (easy) version A
6. Quiz 1 Key
7. Quiz 2 (easy) version
Grades:
7th - 12th, Higher Education, Adult Education
Types:
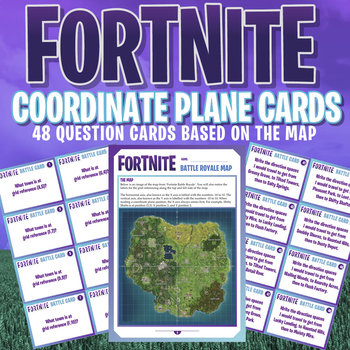
FORTNITE - MATHS - COORDINATE PLANE ACTIVITY CARDS - 48 Question Cards!
SEE OUR EXCITING NEW FORTNITE WORD PUZZLES HERE!HIGH INTEREST - HIGH ENGAGEMENTAn incredible set of 48 question cards, based on the wonderful Fortnite Battle Royale map. Map sheet included!Questions range from the basic naming place at certain coordinate plane reference, right through to the higher level, label the coordinate references of path taken along a designated journey!Great fun for the entire class, and for students of all levels!Check out also the HIGH RESOLUTION MAP PACK available fro
Subjects:
Grades:
4th - 10th, Higher Education, Adult Education, Staff
Types:
Quadratic Bundle-18 Activities-Plus Walls that Teach-19 Worksheets-Graphing
This quadratic bundle several games, sorts, worksheets and walls that teach. Each activity includes direction, teaching ideas, printing instructions along with keys. Many activities have multiple ways to use to make them more versatile.The topics:1) Finding quadratic equations given 2 zeros. -Domino Type Matching games -2 difficulty levels -Includes student help pages plus keys2) Matching Parabolas to Equations Matching Games with 16 graphs per level 4 difficulties levels Equ
Subjects:
Grades:
8th - 12th, Higher Education
Types:
Graphing the Derivative of a Function: Inquiry Activity
Graphs of Derivatives - Discovery:
This three-page worksheet will guide your students to graph the derivative of a function and make observations about the following concepts:
* The slope of a tangent line to a curve can be identified at various points and used to create the graph of the derivative.
* The degree of f’(x) is equal to the degree of f(x) minus one.
* The second derivative of f(x) is denoted by f’’(x) and is the derivative of f’(x).
*The derivative of a cubic function is a quadrat
Grades:
11th - 12th, Higher Education
Types:
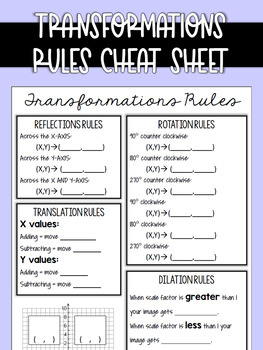
Transformations Rules Cheat Sheet
Cheat sheet for students to fill out to help them remember the rules of transformations.
Grades:
8th - 10th, Higher Education
Types:
Also included in: Transformations practice bundle
Valentine Day Graph
Valentine Day graph and symmetry activity for coordinate plane
Not only do students need to know how to graph line segments they will use their symmetry skills to complete the Valentine Day heart.
This file contains 8 pages.
Heart Graph in Quadrant I in color
Heart Graph in Quadrant I with black and white graphics
Heart Graph in Quadrant I with outline graphics
Heart Graph in Quadrant I Key
Heart Graph in Quadrant I, II, III, and IV in color
Heart Graph in Quadrant I, II, III, and IV with b
Subjects:
Grades:
5th - 12th, Higher Education, Adult Education
Types:
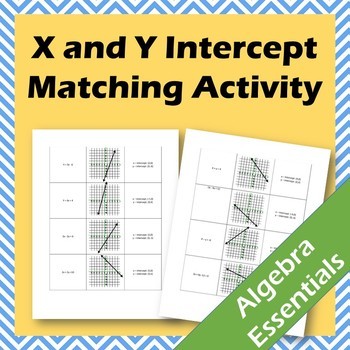
X- and Y-Intercept Matching Activity (CCSS.HSF.IF.B.4)
This matching activity is designed to be practice for students in finding the x- and y-intercepts of a graph and from an equation. Students will have to use critical thinking skills in order to match the three sets. Finding intercepts is a difficult task for students to attain. This practice will help students see the relation between an ordered pair, equation of a line and a graphed line.
You may also like:
X and Y-intercepts Scavenger Hunt
Linear Modeling Projects!
Modeling Activity
Piecew
Grades:
6th - 12th, Higher Education, Adult Education
Types:
Also included in: X & Y Intercept Matching and Scavenger Hunt Bundle (CCSS.HSF.IF.B.4)
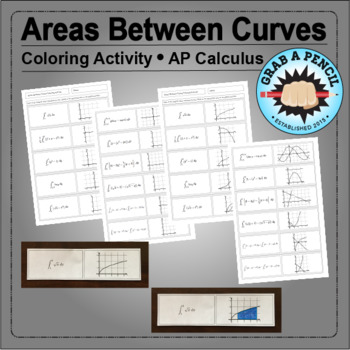
AP Calculus: Areas Between Curves Coloring Activity
There is something satisfying about coloring. It's straightforward and fun.
This activity asks students to do some coloring. Here's how it works: Students are provided with a series of definite integrals. Each integral represents an area. The students are asked to color in this area on the grid provided.
There are two versions: One with the graphs provided and one without the graphs.
This activity is appropriate for both AP Calculus AB and BC.
An answer key is included.
Some suggestio
Subjects:
Grades:
10th - 12th, Higher Education
Types:
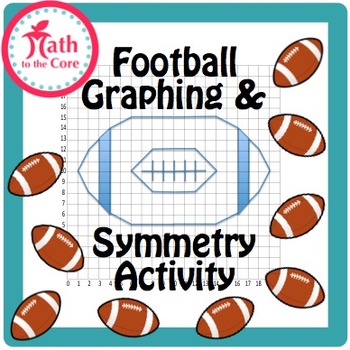
Football Graph and Symmetry Activity for Coordinate Plane
Football Graph and Symmetry Activity for Coordinate Plane
Not only do students need to know how to graph line segments they will use their symmetry skills to complete the football.
This file contains 8 pages.
Football Graph in Quadrant I in color
Football Graph in Quadrant I in black & white
Football Graph in Quadrant I without graphics
Football Graph in Quadrant I Key
Football Graph in Quadrant I, II, III, & IV in color
Football Graph in Quadrant I, II, III, & IV in black &
Subjects:
Grades:
5th - 12th, Higher Education, Adult Education
Types:
Slope Graphic Organizer and Guided Notes
This is a great graphic organizer to help students recall four different ways to find the slope of a linear function. These four ways include: From a graph, an equation, a table, and two given points.
The second graphic organizer helps students have a reference guide for positive, negative, zero, and undefined slope.
This graphic organizer has guided notes, multiple examples, and little tricks to help students remember positive, negative, zero, and undefined slope.
The Link-Slope Task Car
Grades:
6th - 12th, Higher Education, Adult Education
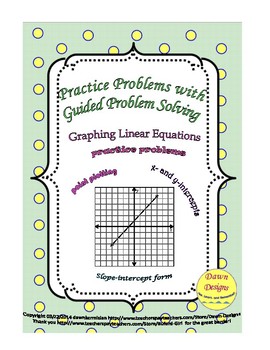
Graphing Linear Equations - Practice: Plot Points, X- and Y-Intercepts, Slope
This worksheet packet was designed to be used after lecture for extra practice. Charts and rectangular (Cartesian) coordinate grids are provided to aid in plotting the ordered pairs on the graph. Three methods for graphing lines are included:• Point Plotting• X- and Y-Intercepts• Slope-InterceptSolutions are provided, which are duplicates of the practice problem pages with the answers filled in and the graphing completed.You may also be interested in these graphing worksheet products:Graphing Li
Subjects:
Grades:
7th - 11th, Higher Education, Adult Education
Types:
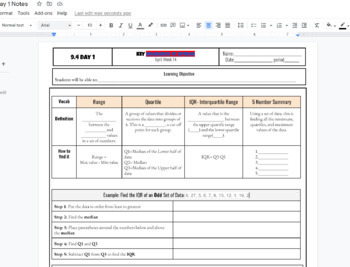
IQR interquartile Range and 5 number summary box and whisker plot Notes
IQR interquartile Range and 5 number summary box and whisker plot Notes including Q1, Q2, Q3, Min and Max and step by step both examples of finding the IQR and creating a box and whisker plot. Used in HS math 1 class WITH KEY INCLUDED AS a link to a printable PDF
Subjects:
Grades:
7th - 12th, Higher Education, Adult Education
CCSS:
Crash Course Algebra COMPLETE SERIES ~ 15 Episode Guides
Distance Learning - #DistanceLearningEpisode Guides for the Crash Course Study Hall: Algebra YouTube Series!Each guide comes with two versions (with and without timestamps), and a complete answer key.This product easy to use, no-prep product is a perfect last minute lesson plan, review activity, extra "filler" to keep on hand, substitute lesson plan, or homework assignment.Plus it's only $0.80 per episode!-Answer key included for every episode guide-Questions are a variety of formats and vary wi
Grades:
5th - 12th, Higher Education, Adult Education
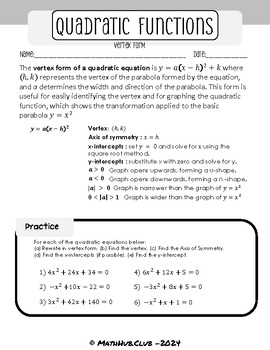
Intermediate Algebra Standard to Vertex Form + Key Elements Worksheet 1
Quadratic Equations: Standard to Vertex Form + Key Elements Worksheet 1Elevate your algebra curriculum with our comprehensive worksheet on quadratic equations, focusing on converting standard form to vertex form and identifying key elements. This resource, Worksheet 2 in the series, guides students through the process of finding the vertex, axis of symmetry, x-intercepts, and y-intercepts without encountering imaginary numbers.With practice problems that may require rationalizing the denominator
Subjects:
Grades:
12th, Higher Education
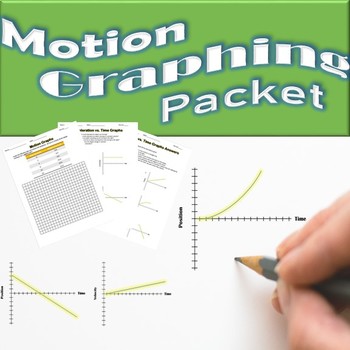
Position, Velocity and Acceleration vs. Time Graph Packet
Video Lessons that go along with this worksheet. Motion Graphs in Physics Video Lessonhttps://youtu.be/duTwepD1f-IDisplacement Time Graphshttps://youtu.be/qgbKER-XRJkVelocity vs. Time Graphshttps://youtu.be/1RroR1-Aiz4Kinematics Motion Graph Questionshttps://www.youtube.com/watch?v=qE_xPS6454c&t=307sYour students will gain a deep understanding of the different types of motion graphs after completing this packet. Students will learn to draw the correctly shaped lines for different types of gr
Subjects:
Grades:
9th - 12th, Higher Education
Types:
Secant Cosecant Graph Activity
This is one of my favorite activities to do in the trigonometry unit. After students learn about the unit circle, including positive and negative angles in radian form and graphing sine & cosine waves, this activity creates the perfect transition to graphing secant and cosecant functions. The activity is laid-out step-by-step so that students can follow the instructions without a teacher by their side. It is an outstanding small group activity, but I have used it as a homework assignment,
Subjects:
Grades:
10th - 12th, Higher Education
Types:
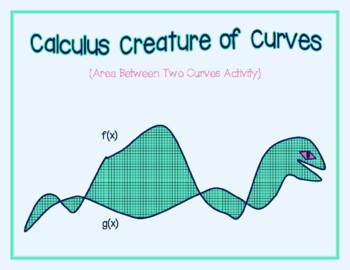
Calculus Creature of Curves (Area Between Two Curves Activity/Worksheet)
Finding the AREA BETWEEN TWO CURVES is an extremely important concept for students to master in any level of Calculus that involves integration. With this activity a student must set up an integral by choosing the correct limits of integration and equations of curves to use from a given graph in order to find the area between two curves. There are 6 regions on the Calculus Creature for which to find the area and then calculate the sum of the 6 regions. The points of intersection for the curve
Grades:
10th - 12th, Higher Education
Types:
Television advertisements Slopes, regressions, lines of best fit Superbowl
Students will be asked to create two scatter plots (one for games 1-23 and a second for games 24-46). Students will then choose appropriate regression models for the growth of advertising costs. Students will choose these models based on visual representations as well as appropriate r or r2 values. Teachers can also introduce residuals here. Teachers can also help the students graph the equations as a piecewise function so that they can see the change in growth rate. Super Teachers need to
Subjects:
Grades:
7th - 12th, Higher Education, Adult Education, Staff
Types:
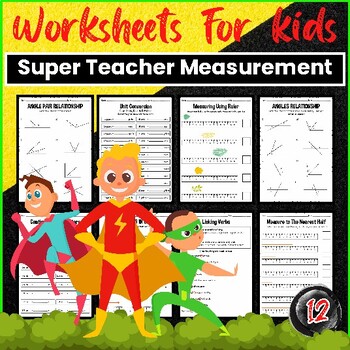
Super Teacher Worksheets Measurement
Super Teacher Worksheets is an essential resource for educators and parents seeking high-quality measurement activities and exercises. With a wide range of engaging worksheets, this platform caters to the needs of both teachers and students. From understanding the basics of measurement to mastering complex concepts, Super Teacher Worksheets provides invaluable practice and reinforcement. Whether you are a teacher searching for supplementary materials or a parent looking to support your child's l
Subjects:
Grades:
7th - 12th, Higher Education, Staff
Types:
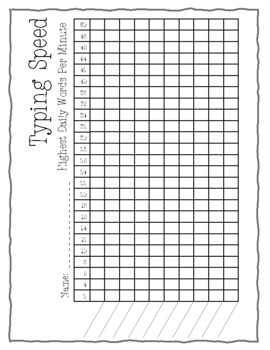
Words Per Minute Typing Graph
Keyboarding is an important skill today, especially for grades 3-5! This graph helps your students to keep track of their typing speed, encouraging more practice and determination! Students can write the date of their typing speed on the X axis, and graph their speed using the y axis (skip counting by 2s).These are great for data folders, Student-Led Conferences, and just real-life graphing skills!
Subjects:
Grades:
K - 12th, Higher Education, Adult Education, Staff
Types:
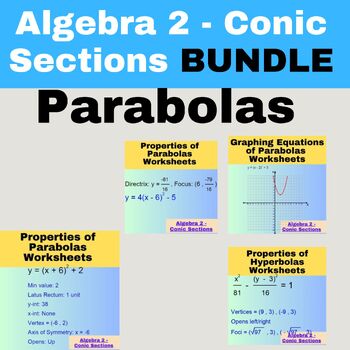
Algebra 2 - Conic Sections - Parabolas Worksheets BUNDLE
Title: "Algebra 2 - Conic Sections: Parabolas Worksheets Bundle"Description: Master the intricacies of parabolas in Conic Sections with our comprehensive bundle. This bundle includes diverse resources focusing on various aspects of parabolas, covering properties, equation writing, graphing, and more.Bundle Components: Properties of Parabolas Worksheets: Detailed exercises exploring the properties and characteristics of parabolas. Writing Equations of Parabolas Worksheets: Practice sheets for for
Subjects:
Grades:
11th - 12th, Higher Education
Types:

Chemistry High School Solubility Curve-Rock Candy Lab STEM
Your High School students will be motivated to perform about this experiment to determine the solubility curve for sugar at various temperatures. Written for the High School classroom it will make learning chemistry FUN. Detailed instructions and questions at the end to make certain that students have mastered the skill. Classroom-testedMaterialsMaterials150 mL water Teacher notes I found about 1:2.5 water: sugar ratio works well for crystals within a day. And it’s very important that they ad
Subjects:
Grades:
8th - 12th, Higher Education
Types:
NGSS:
HS-PS1-6
, HS-PS1-5
Also included in: High School Chemistry MEGA Bundle
Showing 1-24 of 284 results


