111 results
12th grade graphing posters
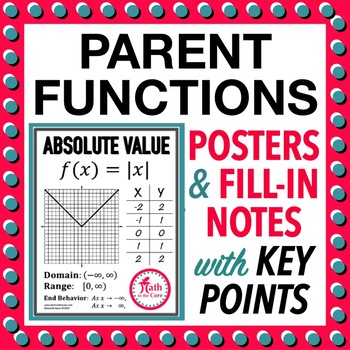
Parent Function Graph Posters with Domain Range and Key Points
Parent Function Graph Posters with Domain Range and Key Points***Completely Updated***This file contains 11 posters containing the graph, domain, range, end behavior and primary (graphing transformation) points of the following parent functions:square rootcube rootcubicquadraticlinearconstantgreatest integerabsolute valuereciprocalexponentlogarithmicA fill-in version is also included. The following 9 functions have been condensed onto one page. Perfect for INBs or a quick review. square rootcube
Subjects:
Grades:
9th - 12th
Types:
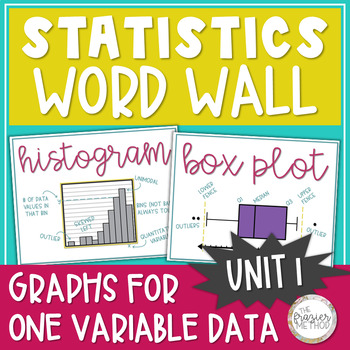
Statistics Word Wall Posters - Histogram, Box Plot, Bar Graph, Dot Plot Unit 1
Use these Statistics Posters to add high school math classroom decor to your bulletin board, hallway, math word wall, or classroom door with these great 8.5" by 11" Statistics Word Wall pages filled with statistics vocabulary, formulas, and graphs! All graphs are from Unit 1: Exploring One-Variable Data in AP Statistics, and the information on each slide aligns with AP College Board's objectives and standards for AP Statistics. ALL PAGES ARE IN COLOR & GRAYSCALE.Size: 8.5 by 11 inches[If you
Subjects:
Grades:
10th - 12th
Classroom Banners: Latitude & Longitude, Row & Column, Horizontal & Vertical
Display these cute, modern-colored classroom banners as a reference point for your students throughout the year. The banners spell out the following:LATITUDE and LONGITUDEROW and COLUMNHORIZONTAL and VERTICAL Each pair is made in matching inverse color/pattern. Each letter tile is 5x5.5 inches.
Subjects:
Grades:
PreK - 12th

Transformations of Exponential Functions POSTER (GSE Algebra 1)
This poster shows the transformations that may happen to exponential equations. It is colored to help students keep all the different transformations straight.
Subjects:
Grades:
8th - 12th
Types:
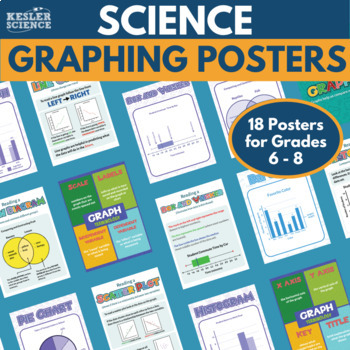
Science Graphing 6th, 7th, 8th Grade Poster Set
The 18 science graphing posters in this colorful cross-curricular resource include vocabulary, examples, and explanations of seven types of graphs - just right for middle school students learning the fundamentals of science graphing and data analysis. If your students struggle to understand science or math graphing - you're not alone! Students need to learn to distinguish independent and dependent variables, practice recognizing different types of graphs, and understand how and when to use the d
Subjects:
Grades:
5th - 12th
Also included in: Science Graphing Bundle for Middle School - Graphs, Math Integration
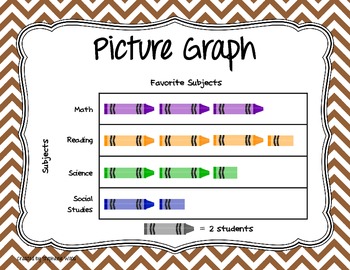
Types of Graphs Posters
Posters showing the various types of graphs for data display.
Includes:
Line Plot/Dot Plot
Line Graph
Bar Graph (Horizontal and Vertical)
Stem & Leaf Plot
Histogram
Box & Whisker Plot/Box Plot
Frequency Table
Circle Graph
Pictograph
Subjects:
Grades:
K - 12th, Higher Education, Adult Education
Types:
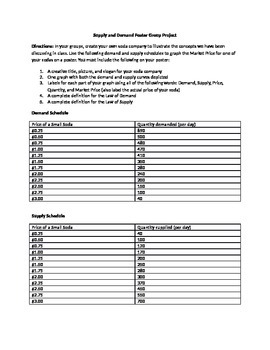
Supply and Demand Poster Group Project
I use this lesson as a summative authentic assessment for the Economic concepts of the Laws of Supply and Demand, Supply and Demand Curves, and Market Price (Equilibrium).
I divide my students into groups of 3-4 and have them create their own unique soda, product slogan, and graph the given supply and demand schedules to find the Market Price for their new soda.
This lesson requires poster paper, markers/colored pencils, and rulers and will take about an hour to complete.
This lesson inclu
Subjects:
Grades:
9th - 12th
Types:
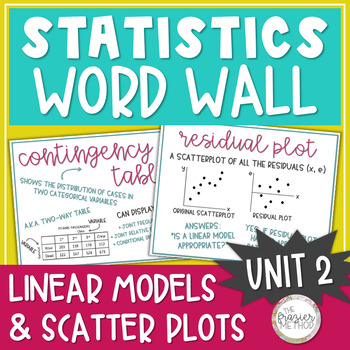
Statistics Word Wall Posters - Scatter Plot, Linear Model, Residual, Correlation
Use these Statistics Posters to add high school math classroom decor to your bulletin board, hallway, math word wall, or classroom door with these great 8.5" by 11" Statistics Word Wall pages filled with statistics vocabulary, formulas, and graphs! \Put them up one at a time as you teach through each term or display them all at once. All vocabulary, formulas, and graphs are from Unit 2: Exploring Two-Variable Data in AP Statistics, and the information on each slide aligns with AP College Board'
Subjects:
Grades:
10th - 12th, Higher Education
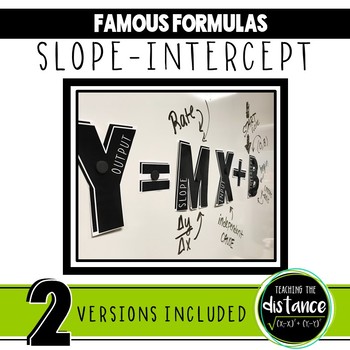
Slope-Intercept Banner
Slope-Intercept BannerThis product includes a two versions of the slope-intercept formula (y=mx+b). Each letter contains a key word that describes what the variable represents. The pieces can be cut out and hung in the classroom as a banner, attached to a bulletin board, or displayed on a whiteboard or chalkboard. Separate pieces allow students to manipulate the formula, substitute values for variables, or take notes around each piece of the formula.Includes: - Y = M X + B pieces (1 lette
Grades:
8th - 12th
Types:
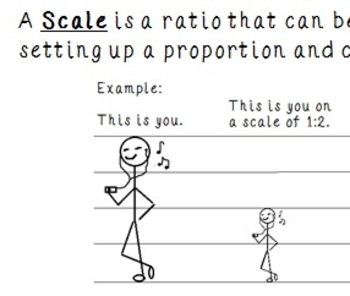
Physics: Solving Vectors Mini-Handbook
When I teach about vectors, I find that I often have to pull from a few different sources. Some methods for solving vectors such as using Trig functions and the Pythagorean theorem are found directly in regents review books, but in order to elevate my students' knowledge of vectors, I want them to be able to solve for the resultant of more than just two vectors at a time. Also, vectors at right angles to each other isn't much of a challenge is it?
I remember being troubled at how much trigonome
Grades:
10th - 12th
Types:
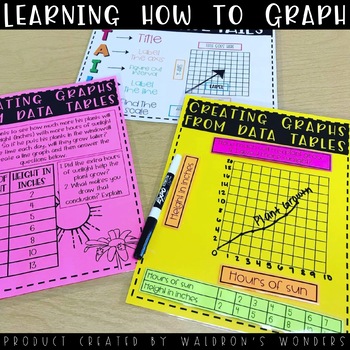
Learning How to Graph
In this product you will find:-How to graph power point to go over the TAILS graphing procedure-Printable 8.5x11 posters for the students to use as a reference to use TAILS-A cut out of TAILS for their interactive notebooks-Creating graphs from word problems and data tables practice (6 different full page printables)-Creating graphs from data tables printables manipulatives (cut and glue/velcro/magnets etc. See product pictures for how I made them with Velcro!-Independent practice (could be a qu
Subjects:
Grades:
4th - 12th
Types:
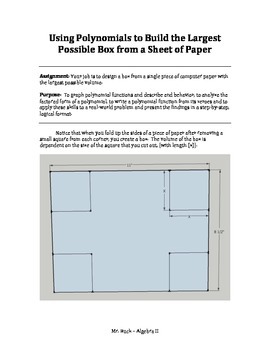
Algebra 2 Polynomials Activity and Lab - Using Polynomials STEM Poster Project
This 2-3 day math project gets students thinking about polynomials in the real world. Students design a box from a sheet of paper with the purpose of maximizing the volume and then display the entire mathematical process on a poster. Students add graphs, a model of the box and explain the entire mathematical process in a logical and sequential order. This project gets students working in groups, discussing ideas and writing about the process they take to solve a problem. Many find the poster
Subjects:
Grades:
10th - 12th, Higher Education
Types:
CCSS:
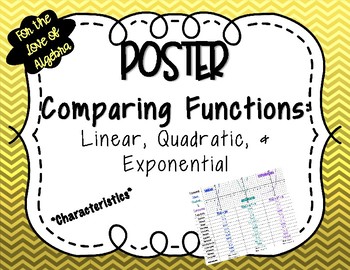
Comparing Characteristics of Linear, Quadratic, & Exponential Functions POSTER
This is a great visual for students while discussing different characteristics of functions. They can see which characteristics don't apply to certain functions. These are NOT the parent functions.**Algebra 1 GSE (Georgia Standards of Excellence) Unit 5: Comparing Functions
Grades:
8th - 12th
Types:
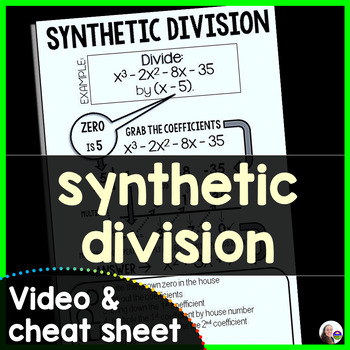
Synthetic Division Cheat Sheet and Video
This synthetic division cheat sheet can be printed for student notebooks as a support during your polynomials unit in algebra 2. The video walks students through the step of synthetic division and can be used as an added support in class or sent to students who were absent. You may also like:Algebra 2 Homework WorksheetsAlgebra 2 Word Wall - print and digitalSketching Polynomial Functions Algebra Task Cards Activity
Subjects:
Grades:
10th - 12th
Types:
Also included in: Algebra 2 Activities Bundle with Digital Updates
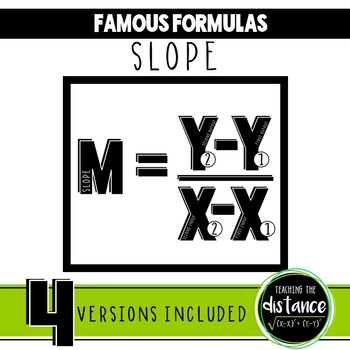
Slope Formula Banner
Slope Formula BannerThis product includes a two versions of the formulas for slope. Each letter contains a key word that describes what the variable represents. The pieces can be cut out and hung in the classroom as a banner, attached to a bulletin board, or displayed on a whiteboard or chalkboard. Separate pieces allow students to manipulate the formula, substitute values for variables, or take notes around each piece of the formula.** Check out my SLOPE-INTERCEPT Famous Formula Banner! **In
Subjects:
Grades:
7th - 12th
Types:
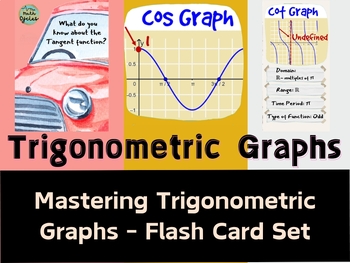
Trigonometric Graphs - Flash Card Set
Mastering Trigonometric Graphs - Flash Card SetThis comprehensive flashcard set on trigonometric graphs and their properties is designed to aid students in mastering the fundamental concepts of trigonometry. Each flash card provides a visual representation of different trigonometric functions, such as sine, cosine, and tangent graphs, along with key properties and characteristics. These high-quality flash cards are perfect for printing out and using as a valuable resource for teaching and learni
Subjects:
Grades:
8th - 12th
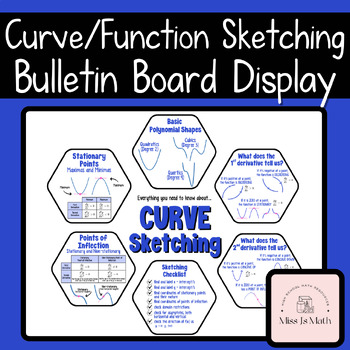
Curve/Function Sketching Bulletin Board Wall Display - Shape, derivatives etc.
This Curve/Function Sketching Bulletin Board Wall Display includes a large selection of angle properties to simply print, cut and laminate. Elements are provided separately to allow for easy printing and construction with your class.Preview shows different elements providedDisplay includes:shapes of degree 2, 3 and 4 functionstypes of stationary pointstypes of points of inflectionsproperties of the first derivativeproperties of the second derivativechecklist for sketching functions (things that
Grades:
10th - 12th
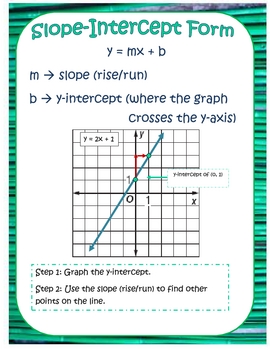
Equation of a Line Poster
Posters with definitions, and visual examples of slope-intercept form, slope, and standard form. Perfect for printing and laminating to display.
Grades:
7th - 12th
Types:
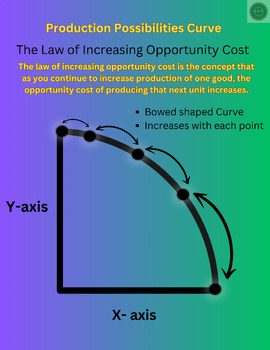
Production Possibilities Curve Bundle
Production Possibilities Curve The Law of Increasing Opportunity Cost and Constant opportunity cost Infographic/ Flyer bundle.
Subjects:
Grades:
9th - 12th
Types:
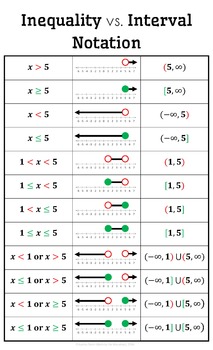
Inequality vs. Interval Notation Posters
Help your students see the connections between the inequality symbols, the choice of open/closed points on a number-line, and the choice of soft/hard brackets in the interval notation. I encourage you to use the color-coded version so your students can ask themselves, "Can I include this point?" Green="yes, include", and red="no, exclude." The color-coding follows "stoplight logic" that even your students who struggle the most most understand. Additionally, the color makes it easy to make conn
Subjects:
Grades:
7th - 12th
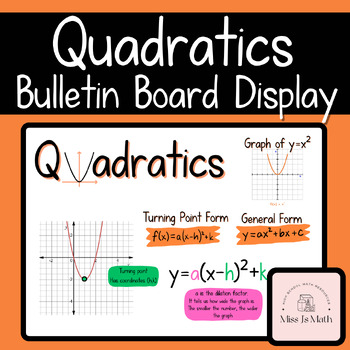
Quadratics (Parabolas) Bulletin Board Wall Display
This Quadratics (Parabolas) Bulletin Board Wall Display includes properties of quadratics, each supplied separately and in different sizes to simply print, cut and laminate. Each element is supplied to be separately cut out for easy co-construction with your class.Display includes:Quadratics titleParabolas titleGeneral form of equationTurning point form of equationGraph of y=x^2Graph of quadratic with label for turning pointTurning point form with colour coded dilation and translation factors
Grades:
9th - 12th
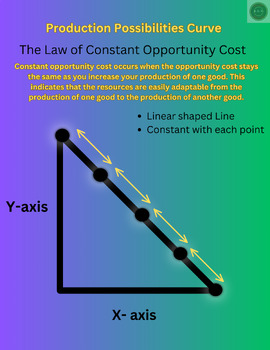
Production Possibilities Curve The Law of Constant Opportunity Cost Infographic
Production Possibilities Curve The Law of Constant Opportunity Cost infographic/ Flyer.
Subjects:
Grades:
9th - 12th
Types:
Also included in: Production Possibilities Curve Bundle
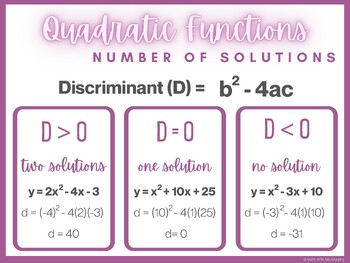
Quadratic Number of Solutions: Discriminant Anchor Chart
Print this PDF as a handout for students or as a poster to keep in your classroom.Post it in your online classroom for students and parents to reference as an additional resource.This quick overview with an example of each will be a great way for to students to initially learn about the number of solutions in quadratic functions by finding the discriminant.

MLB Coordinate Graph - Philadelphia Phillies
Students will be able to graph in all 4 quadrants using rational numbers
Grades:
6th - 12th
Types:
Showing 1-24 of 111 results


