48 results
4th grade graphing rubrics
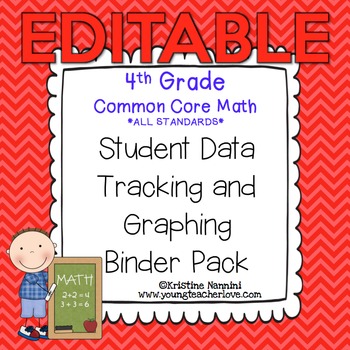
Student Data Tracking Binder - 4th Grade Math - Editable
These Student Data Tracking Binders are an easy-to-implement system. Put students in charge of tracking their own learning and data! With this Student Data Tracking Binder, your students will monitor their own growth and progress using standards based assessments (also found in my store), rate and date their learning using Marzano's Levels of Thinking/Understanding, and keep track of "I can" statements or learning targets as they progress through the Common Core Standards. This resource is now e
Subjects:
Grades:
4th
Types:
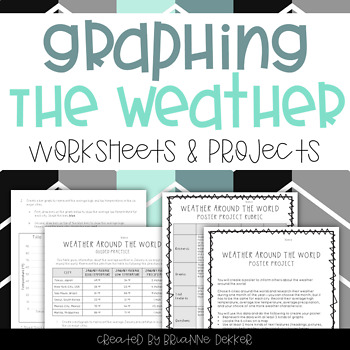
Graphing the Weather - Worksheets and Projects
This product contains science and math graphing worksheets and projects for a unit on weather. These resources were created with NGSS content and evidence statements in mind.
The first set of worksheets focus on weather around the world, and the second set focus on weather patterns in one area. Each set contains guided practice, in which students are given data and asked to create different types of graphs to represent the data; independent practice, in which students must gather data and then
Subjects:
Grades:
3rd - 5th
Types:

Fluency Graphs (Monster Readers Theme)
Monster Readers Fluency Graphs--
Monitor your monster readers' fluency progress!
Great for record-keeping and data management!
In this packet, you will find:
* About Fluency & Tracking Progress (basic facts)
* Background Info on Timed Reading, Target Charts & Recording Sheets
* 5 Different Graphs: 60, 100, 120, 150 plus blank one to write in goal targets
* A class profile sheet
* Fluency Rubric
* Fun partner recording sheets
* 2 Award Sheets for meeting goals (one color, one b/w--half
Subjects:
Grades:
K - 4th
Types:
Also included in: Reading and Writing Super Mega Bundle Deal
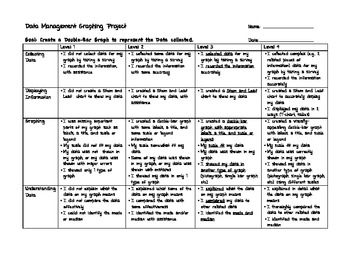
Grade 4 Graphing Project Rubric - Ontario
This is a rubric I created based on the Grade 4 Ontario Curriculum. It includes all specific expectations for Data Management related to graphing (not probability).
The preview is a sample that one student created. He left the bottom blank to print out a picture of LeBron!
I used this to assess a final data management project my class did. Each student had a bristol board and had to:
-collect data through a survey or experiment
-show their data in a tally chart, stem and leaf plot and t-ch
Grades:
4th
Types:
Collecting, Organizing and Interpreting Data Assignment -Data Management Digital
In this culminating task, students will create a survey question, organize their data using frequency tables, graph their data and interpret their results. They will also find the mean, median, mode and range of the data.This is assignment asks students to create a presentation that will include the following:A survey questionMean, Median, Mode and Range of the dataFrequency table for the data3 different visual representations of their findingsInterpretation of the resultsThis product includes
Grades:
4th - 8th
Types:
Mathematics in Nature {CCSS Math and NGSS Aligned}
Students explore and apply the principles of mathematical patterns in nature in a fun and engaging way! First, students identify and describe patterns in the natural world before heading outside to find patterns on their own. Next, students begin to explore number patterns in nature using the Fibonacci sequence. Fin fingerprint activity keeps students interested and engaged! Next, explore cycles in nature by creating a model on paper using 3-dimensional objects. Rubric included. Students are
Grades:
4th - 7th
Types:
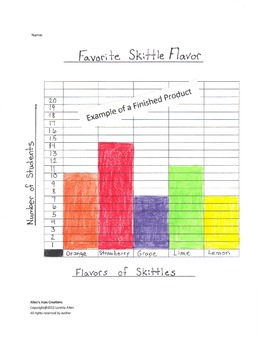
Bar Graphing - Skittles Candy
Students will taste test each Skittles Candy flavor, and then ask their classmates their favorite flavors and record the data collected. Then they use their data to create a bar graph. I use this in my 3rd grade class and it is always a big hit activity!
Subjects:
Grades:
2nd - 6th
Types:
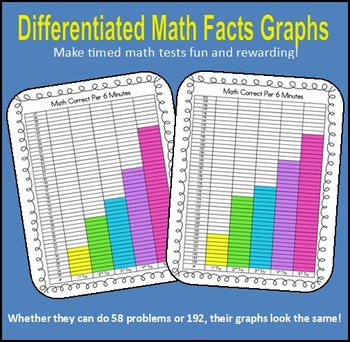
Differentiated Math Facts Graphs
These "Differentiated Math Facts Graphs" allow the kids to graph the scores of their timed math facts tests. The visual encourages students to work towards beating their own scores.
I've found that my students do not compare graphs based on the tiny numbers to the side, but rather by whose bar is tallest or who made the most growth. This allows even the struggling students to be recognized and feel great for their hard work!
Can be used with addition, subtraction, multiplication, or divisi
Subjects:
Grades:
1st - 4th
Types:
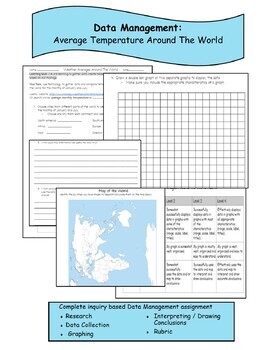
Data Management Assessment-Average Temp Around The World -Distance Learning
This comprehensive Data Management assessment incorporates real life application and authentic learning. This activity can be used as a formative assessment during a unit, after a unit or part of your math centers. It incorporates inquiry and research to engage and stimulate learning.It includes:ResearchData CollectionGraphingInterpreting, Analyzing and Drawing ConclusionsRubric
Grade 4 - Math: Data Management/Graphing Summative Assessment/Test
You will receive a digital copy of a Grade 4 Ontario Math Assessment/Test that will allow you to obtain an easy assessment mark/grade for your students to receive on their report card. The work is all done for you!This item is created by an Ontario Certified teacher who has 15 years of experience.Thank you for purchasing!
Grades:
4th
Types:
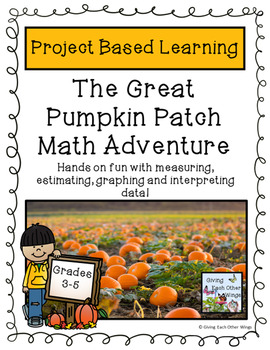
The Great Pumpkin Patch Math Adventure
Wow! Lots of fun combined with lots of math, reading, and science. A perfect recipe for learning! This is one of my favorite fall Project Based Learning math activities to do with my class. The students are so busy having fun, they don't realize how much math they are learning! Students work cooperatively to make estimates about the height, weight, circumference, no. of seeds, and cost of their pumpkin at the Estimation Station. Then they will have fun finding the actual data on their pumpkins.
Subjects:
Grades:
3rd - 5th
Types:
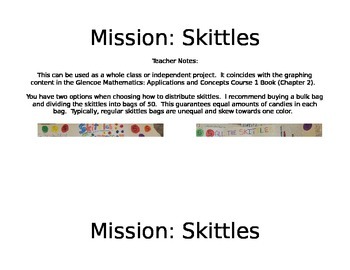
Skittles Graphing Project
This project is all about graphing! Using skittles, students will graph a frequency table, bar graph, circle graph, stem and leaf plot, and find the mean, median, mode, and range of a set of data. They will also have to survey classmates to gather data!

PBL Math project Education vs. Wages
The information provided is a guide to giving your students some freedom and choice in a project based on seeing the value of education in their future.
Subjects:
Grades:
4th - 9th
Types:
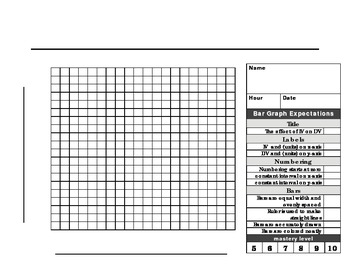
Bar Graph paper and rubric
This 20 X 20 graph paper with rubric is made for a beginner scientist to make a the perfect BAR graph. The checklist format makes it easy for students to know what is expected when graphing. Enjoy!
Subjects:
Grades:
1st - 12th, Higher Education, Adult Education
Types:
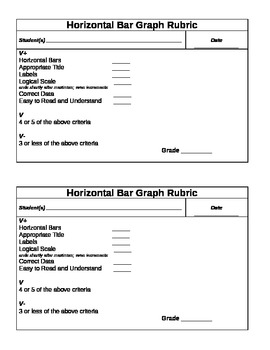
Bar Graph Rubric for Horizontal and Vertical Bars
This rubric can be used for creating bar graphs. It's title and fields can be changed to reflect both horizontal and vertical bars. Please email me at ktastinger@gmail.com if you have any issues editing the file.
Subjects:
Grades:
1st - 4th
Types:
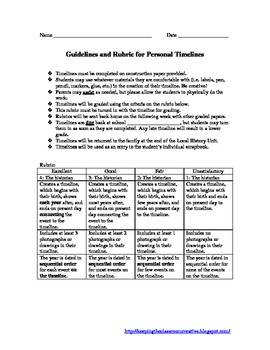
Student Timeline
This is a guide for student creation of a personal timeline. It is connected to Ohio standards in History under Historical Thinking. Timelines are to be completed on construction paper provided by the teacher.
Students may use whatever materials they are comfortable with (i.e. labels, pen, pencil, markers, glue, etc.) in the creation of their timeline. Let them be creative!
Parents may assist as needed, but please allow the students to physically do the work.
Timelines are then graded using the
Grades:
2nd - 6th
Types:
Functions and Graphs Learning Framework | 41 levels | self-paced work plan
This Functions and Graphs Level-up learning framework includes 41 levels and is geared towards helping students learn to deal with more and more advanced problems. The framework includes 213 unique links to support students when they cannot complete the problems in a given level. There are then also links to sources which have relevant problems to ensure that students have a strong grasp on the relevant level of functions and graphs. There is also supportive images included to explain some of th
Subjects:
Grades:
4th - 12th
Types:
Also included in: Algebra | Functions & Graphs Learning Frameworks | 65 levels
Bar Graph Rubric
Makes scoring students bar graphs easy and not subjective
Also has column for student to do a self evaluation
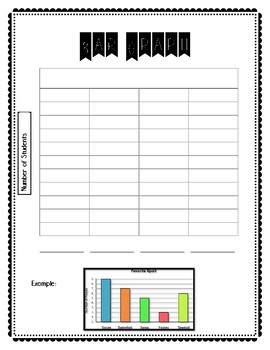
Graphing Performance Task (GOMath Unit 10)
This FUN real world based project starts by asking students to create their own survey question to help the principal learn more about his/her students. After students survey their classmates, they display the data in the form of a tally chart, pictograph, bar graph, and line graph. Students can then take it one step further and create a poster with the information they gathered.I also made this project cross curricular because after making the poster students wrote letters to the principal expl
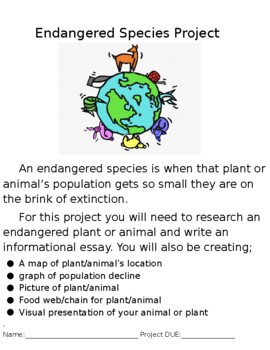
Endangered Species Project
This project encompasses writing about endangered animals. It conforms to NGSS standards as well as Common Core standards for ELA and Math (California). It contains a rubric, graphic organizer, and examples for students. This project can be edited to fit your classroom needs.
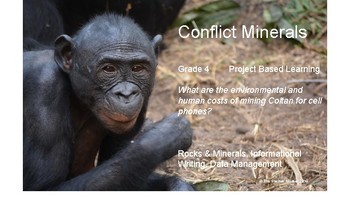
Conflict Minerals: The Environmental and Human Impact of Mining
This product is a guide to inquiry on the topic of mining. This project aligns with the grade 4 Ontario science curriculum (Rocks & Minerals). You won't find any worksheets here. What you will find is a way to engage students in meaningful research about a real-world problem.
You will find:
-teacher guide to the inquiry process,
-an explanation of how students can create impressive bar graphs using google docs
-3 rubrics covering grade 4 expectations in science, data management, and
Subjects:
Grades:
4th
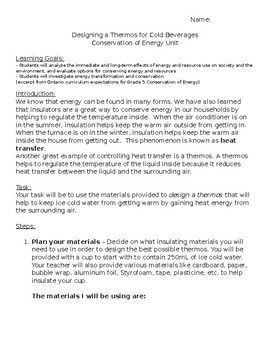
Conservation of Energy - Design a Thermos Project
This project was originally designed to align with the Ontario Grade 5 curriculum expectations for the conservation of energy unit, however can be adapted to meet other curriculum needs easily.
Includes:
- Learning Goals (curriculum expectations)
- Introduction about Conservation of Energy and the concept of heat transfer
- Detailed steps to carry out the project (students won't miss a step and will stay organized)
- Clear, detailed rubric for grading purposes
Materials needed:
- Cups
- Cold w
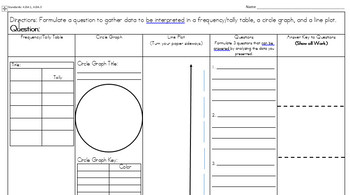
Frequency Table, Line Plot, Circle Graph Assessment and Rubric
This assessment is a great way for students to get involved in the assessment process. Students can choose a question to survey among their classmates and then represent that data in the different formats. It's also covers several standards!
Grades:
4th
Types:
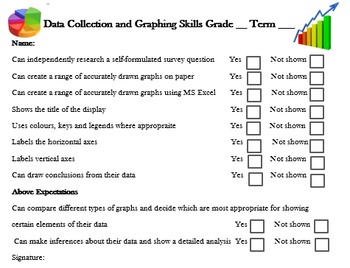
Graph and Data Assessment Checklist & Rubric
Short and quick-to-mark assessment rubric and checklist for graphing tasks suitable for students from grades 2 to 6.
You may also like:
-Comprehensive Multiplication Unit for free
- All Materials Maths units, just click on my store logo to view the full range.
Full set of Maths Assessments:
- Place Value Assessment
- Addition Assessment
- Subtraction Assessment
- Multiplication Assessment
- Division Assessment
- Fractions/Decimals Assessment
Subjects:
Grades:
2nd - 6th
Types:
Showing 1-24 of 48 results


