972 results
4th grade graphing lessons
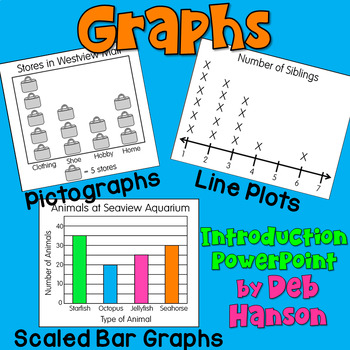
Graphs PowerPoint and Notes: Pictographs, Scaled Bar Graphs, Line Plots
Are you searching for a step-by-step PowerPoint that can be used to introduce graphing concepts to your students in a way that will grab their attention? You've come to the right place! Teach third and fourth-grade students about graphing concepts with this 70-slide PowerPoint lesson. Students will have many opportunities to draw and interpret the various types of graphs. It includes frequency tables, picture graphs, pictographs, scaled picture graphs, scaled bar graphs, and line plots. Use his
Subjects:
Grades:
3rd - 4th
Also included in: Graphs Bundle: Scaled Bar Graphs, Pictographs, and Line Plots
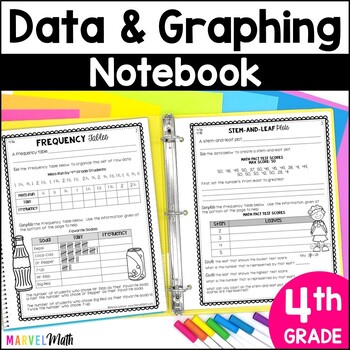
4th Grade TEKS Dot Plots, Stem and Leaf Plots, Graphs, Data Analysis Notebook
This no prep Data Analysis and Graphs notebook thoroughly covers the 4th grade Data Analysis and TEKS: 4.9A & 4.9B. Simply print and hole punch and this notebook is ready for you to teach dot plots, stem-and-leaf plots and frequency tables. Use the pages for whole class or small group guided math lessons while also helping students build their own reference tool.This is a TEKS centered resource. While others may be “TEKS-aligned,” they often cover Common Core standards as well. My Texas
Subjects:
Grades:
4th
Also included in: Math Interactive Notebook 4th Grade - TEKS Bundle
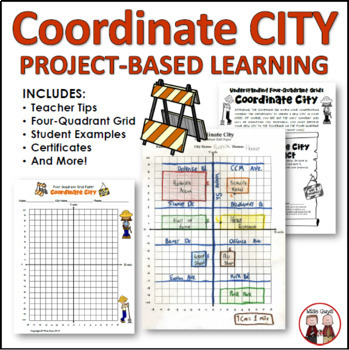
End of Year Math Coordinates City Project
Are you looking for an engaging end of year activity to teach coordinates to your upper elementary and middle school math students? Your upper elementary and middle school students will become engaged as they are asked to design a city based on using a coordinate plane. This is a teacher-friendly resource and minimal prep is involved.This resource contains 9 total documents (12 pages total) that are intended to be a creative math lesson plan that has students create their own city using coordina
Subjects:
Grades:
4th - 6th
Types:
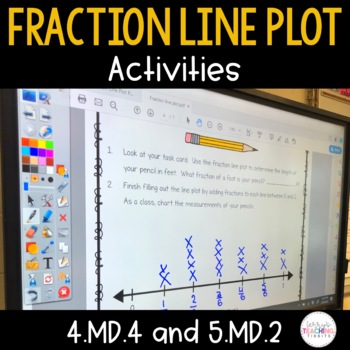
Fraction Line Plot Activities - 4.MD.4 and 5.MD.2
Plotting fractions on a number line has never looked so fun! This pack comes with 3 whole group or small group activities for fraction line plots. Students are given individual task cards of an object measured on a fraction number line. As a class, each student will determine the fraction of their object and plot it onto a class line plot. Students will then use their class-created data and answer to answer questions.What You Get:3 sets of task cards (pencils, nails, and erasers)28 task card
Subjects:
Grades:
4th - 6th
Types:
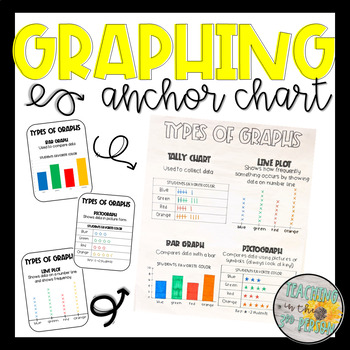
Types of Graphs Anchor Chart - Tally Chart, Bar Graph, Pictograph, Line Plot
Graphing made easy!Use these templates as a guide in creating your own anchor charts or print and use them in other helpful ways:Trace and create an anchor chart with studentsPrint on bright colored paper and use as postersShrink down and glue in student' math notebooks for a reference sheetPrint and send home as reference tools for students and parents (homework or tutoring)Earn Credit for Future Purchases:I appreciate each & every word of your valuable feedback. Also, if you leave feedback
Grade 4, Unit 3: Data Literacy (Ontario Mathematics)
Grade 4, Unit 3: Data Literacy is a 100+ paged resource designed to meet the Ontario 2020 Mathematics curriculum expectations for the Data strand. This resource includes lessons, activities, and assessments that introduce students to multiple bar graphs, stem-and-leaf plots, frequency tables, and infographics. Please note this is a printable resource. There is NO Google Slide component to this resource.Wonderland Math is a math unit series designed to meet the Ontario 2020 Mathematics curriculum
Subjects:
Grades:
4th
Types:
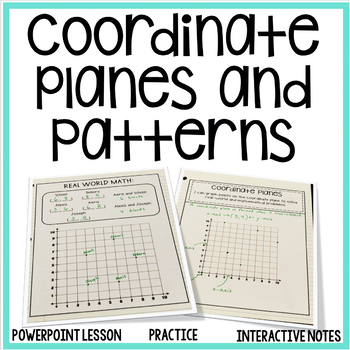
Coordinate Graphing - Coordinate Planes and Numerical Patterns Unit
This Coordinate Planes and Number Patterns Unit is the perfect addition to your math classroom! It includes a PowerPoint Lesson, Interactive Notes, Practice Pages, and an Assessment. Students will learn how to:Generate two numerical patterns using given rules and identify relationships between corresponding terms. Form ordered pairs consisting of corresponding terms from the two patterns and graph the ordered pairs on a coordinate plane.Graph points on the coordinate plane to solve real-world pr
Grades:
4th - 6th
Also included in: 5th Grade Math Bundle for the ENTIRE YEAR!
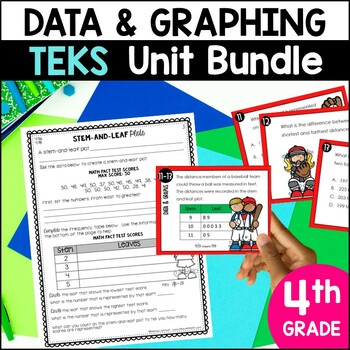
4th Grade Data and Graphing Unit - Stem and Leaf Plots, Data Analysis TEKS
Everything you need for a TEKS centered 4th grade data and graphing unit! Your students will enjoy practicing data analysis, multistep word problems, stem and leaf plots, dot plots, and frequency tables. All of the worksheets, printables, games, and task cards are designed with STAAR testing in mind. ⭐️ BUNDLE & SAVE ⭐️This TEKS graphing and data resource is also a part of the 4th Grade Year-Long Curriculum. Check it out and get everything you need to teach 4th grade math this year! This c
Subjects:
Grades:
4th
Types:
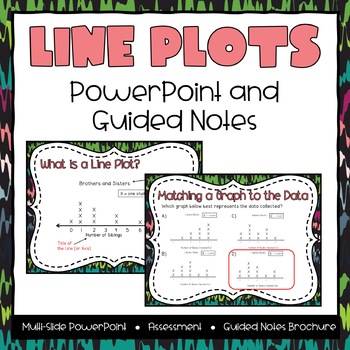
Line Plots Powerpoint & Guided Notes
This product features a 40 page eighties-themed powerpoint presentation that takes students step-by-step through the process how to analyze and interpret line plots using a variety of question types. The presentation includes these topics:- why do we use graphs?- parts of a line plot- reading and analyzing line plots- matching data to a graph- creating a line plot *1 & 2 step questions incorporated The product also comes with a tri-fold brochure that students can fill out while going through
Subjects:
Grades:
2nd - 4th
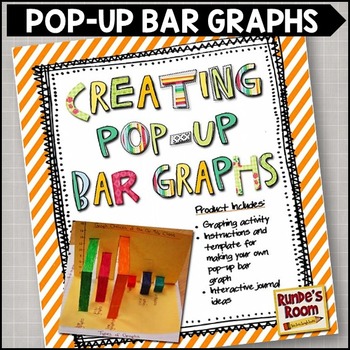
Bar Graph Activity 3D Graphing Assignment
Make your data management and graphing lessons stand up and out with 3D pop-up bar graphs! These 3D bar graphs can be added to your interactive notebooks or display on their own for any data activity you complete.This resource includes: •2 different bar graph activities (one with intervals and one without)•student handouts•instructions on how to build a 3D pop-up bar graph (that can be adapted to any bar graph activity)•interactive journal ideas•student reflection ideasPictures of completed exa
Grades:
3rd - 6th
Types:
Also included in: Graphing and Data Activity Bundle for Upper Grades
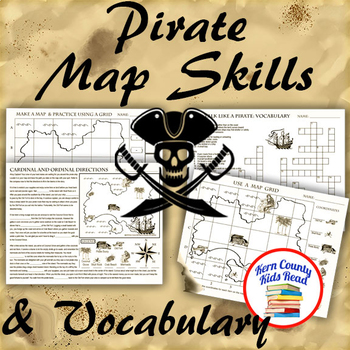
Pirate Map Skills: Grid Coordinates, Cardinal & Ordinal Directions, Symbols
Teach and strengthen coordinate grid math, geography mapping skills like map symbols and cardinal and ordinal directions with a compass rose, and new vocabulary with these pirate themed printable worksheets. These are fun mini-lesson activities for Talk Like A Pirate Day on September 19th or if you have a pirates themed unit. Cardinal directions and coordinate grid mapping are important introductory skills to mastering latitude and longitude map skills and being able to use an atlas. Coordinate
Subjects:
Grades:
3rd - 6th
Also included in: Pirates Thematic Unit Study Bundle: Talk Like A Pirate Pack!
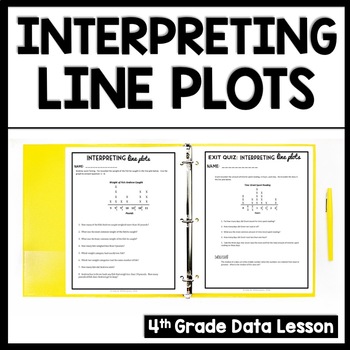
Line Plot Worksheets with Fractions, 4th Grade Dot Plots Activities & Practice
Looking for line plot worksheets for 4th grade that build true understanding? Try these Line Plot with Fractions Worksheets! After 8 pages of line plot activities (dot plots worksheets), your students will be experts! This 4th Grade Line Plot Practice Packet is the perfect supplement to your core curriculum or a great activity for math intervention. Best of all, these line plot activities require NO PREP! Just print and teach!These Fraction Line Plot Worksheets include: ✅ Scripted Instructiona
Subjects:
Grades:
4th - 5th
CCSS:
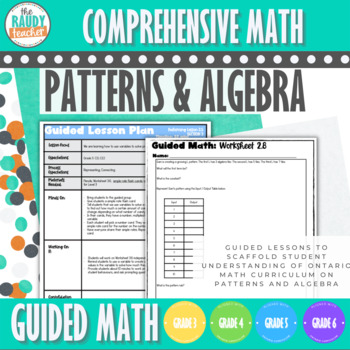
Ontario Guided Math Unit - PATTERNING -Patterns & Algebra - Grades 3,4, 5, 6
Make teaching Patterns and Algebra fun with these differentiated lessons and activities! This FULL UNIT includes 4 pathways with differentiated lessons PATTERNS.. It helps you identify and target student gaps in their patterning.This is FULLY aligned with the New Math Curriculum 2020 - and supports Grades 3-6! PERFECT FOR ALL OF THESE GRADES OR DIFFERENTIATION! This unit is full of Assessment For and Assessment As Learning tasks that fulfill expectations in B NUMBER Strand in the New Ontario Mat
Grades:
3rd - 6th
Types:
Also included in: Ontario Guided Math BUNDLE - 8 UNITS - ALL STRANDS - Grades 3, 4, 5, 6
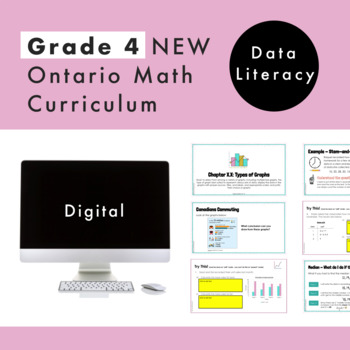
Grade 4 Ontario Math - Data Literacy Curriculum - Digital Google Slides + Form
Are you planning for the NEW Grade 4 Ontario Math Curriculum? This editable Google Slide resource is what you need! This resource is for the DATA strand and covers ALL specific expectations for “D1. Data Literacy”. In this resource, students will experience math through engaging real-life questions, storytelling through math, and interactive slides. What’s Included6 Google Slide presentations147 UNIQUE and EDITABLE Google Slides in totalSlides are editable for you to increase student engagemen
Subjects:
Grades:
3rd - 5th
Types:
Also included in: Grade 4 NEW Ontario Math Curriculum Full Year Digital Slides Bundle
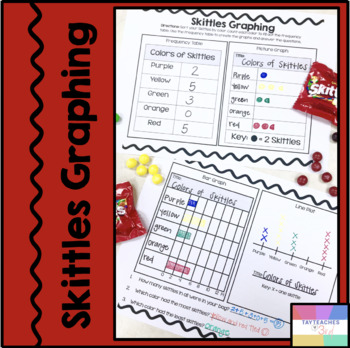
Skittles Graphing-Bar Graph, Line Plot, Picture Graph
This is a super fun activity to go along with your graphing unit. My students really struggle with following the key on a picture graph, so this was great practice! Includes: -2 Pages (to be printed front and back) Frequency Table (students sort skittles and fill in the table) Picture Graph, Key is counting by 2's, Students practice filling in the graph titles and pictures (some pictures will need to show half a skittle for odd number counts)Bar Graph, Scale is counting by 2's Line Plot Data Ana
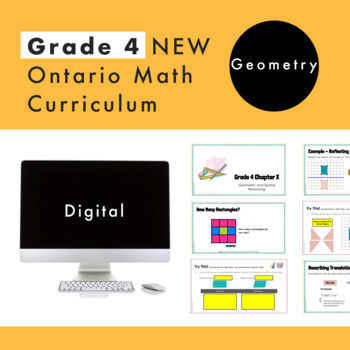
Grade 4 Ontario Math - Geometry Curriculum - Digital Google Slides + Form
Are you planning for the NEW Grade 4 Ontario Math Curriculum? This editable Google Slide and Google Form resource is what you need! This resource is for the SPATIAL SENSE strand and covers ALL specific expectations for “E1 Geometric and Spatial Reasoning”. In this resource, students will experience math through engaging real-life questions, storytelling through math, and interactive slides. What’s Included4 Google Slide presentations95 UNIQUE and EDITABLE Google Slides in totalSlides are edita
Grades:
3rd - 5th
Types:
Also included in: Grade 4 NEW Ontario Math Curriculum Full Year Digital Slides Bundle
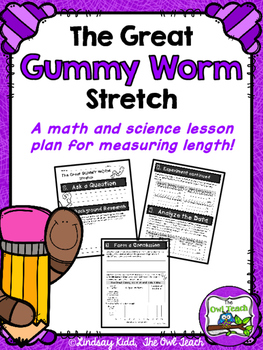
Measuring Length: {Measurement Science and Math Lab Activity}
This Measuring Length Activity is a hands-on, math and science integrated LAB, which takes students through the scientific method to measure the length of two different types of gummy worms in customary and metric units to see which type of candy worm stretches the greatest amount overall! This is easy to follow, fun, and a great way to practice measurement and data standards!
Included in this Packet:
-Teacher Directions (2 pages)
-Student Lab Sheet (4 pages)
-Grading Rubric (1 page)
Measurin
Subjects:
Grades:
1st - 4th
Types:
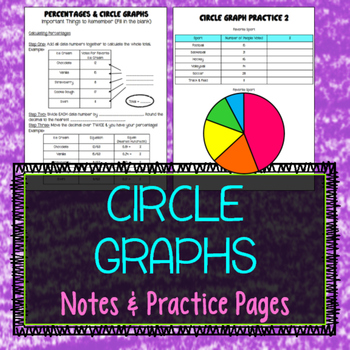
Circle Graph Notes and Practice
Circle graphs are used when you want a visual comparison of percentages! Before you can create the graphs, students must master the skill of calculating percentages!
This product includes:
- Circle Graphs Guided Notes + Answer Key
- Calculating Percentages Practice Sheet
- FOUR Circle Graph Practice Problems
- One Blank Circle Graph to use your own data
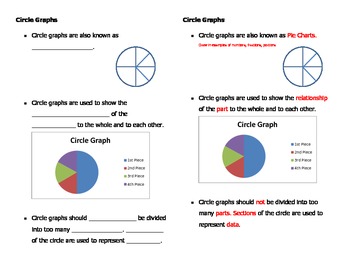
Construct, Compare, Interpret Circle Graphs
Mini Unit: Circle graphs are studied through several guided lessons and independent practice worksheets. Guided notes examine circle graphs and the types of data they represent and are perfect for your interactive notebook. Graphs are constructed to and from a bar graph. Problems involve evaluating and interpreting data through the percents, portions, and fractions represented by graphs. For use in upper elementary and middle school exceptional and general education classrooms.
Subjects:
Grades:
4th - 9th
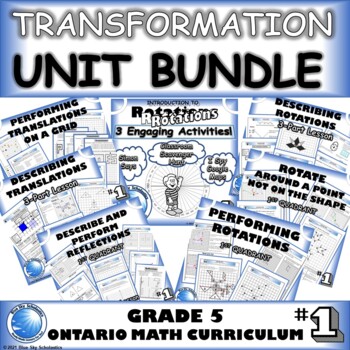
Transformations Unit: Translations, Reflections & Rotations in the 1st Quadrant
A location and movement (transformations) unit that includes engaging lessons and activities to teach your students to plot and read coordinates, and perform and describe translations, reflections, and rotations in the 1st quadrant of a Cartesian plane. Many of the activities are perfect for students who are initially learning how to rotate shapes on a grid. NOTE: Some of these lessons are included in my Location and Movement Unit: Transformations in the 1st Quadrant Bundle, which was designed
Grades:
4th - 5th
Types:
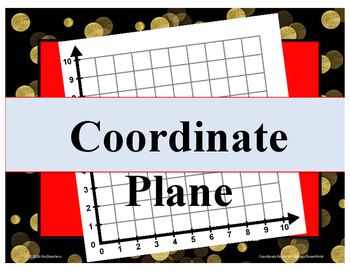
Coordinate Plane PowerPoint
Introduce Coordinate Planes - also called Coordinate Grids with this easy to follow PowerPoint presentation that follows a gradual release method of teaching. It gives your students a great visual as you walk through your introduction. This product is just for quadrant I.What Does This Include?This PowerPoint introduces: - coordinate plane - x-axis - y-axis - origin - ordered pairs - x-coordinate - y-coordinateWhat Is The Format?This is a PowerPoint presentation. Throughout the PowerPo
Grades:
4th - 6th
CCSS:
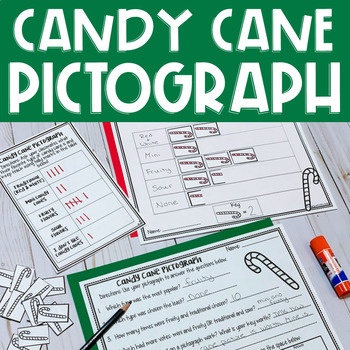
Candy Cane Pictograph - Christmas Graphing
Do you need a fun way to practice pictographs or graphing? I love this hands-on graphing activity because it's engaging and gets students up and moving! Plus it's perfect to use during the Christmas season or the last week before Christmas break!This product is an easy way to practice making pictographs (specifically geared toward the 3rd grade classroom)! I know that sometimes understanding pictographs can be confusing for students-- so I like to use this "make your own" graph to help them take
Subjects:
Grades:
2nd - 4th
Types:
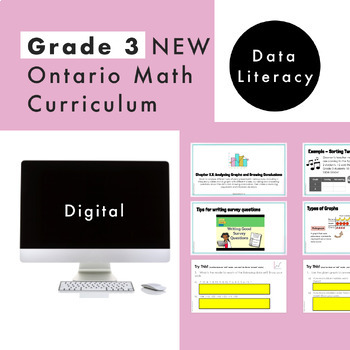
Grade 3 Ontario Math - Data Literacy - Digital Google Slides + Form
Are you planning for the NEW Grade 3 Ontario Math Curriculum? This editable Google Slide resource is what you need! This resource is for the DATA strand and covers ALL specific expectations for “D1. Data Literacy". In this resource, students will experience math through engaging real-life questions, storytelling through math, and interactive slides. What’s Included6 Google Slide presentations149 UNIQUE and EDITABLE Google Slides in totalSlides are editable for you to increase student engagemen
Subjects:
Grades:
2nd - 4th
Types:
CCSS:
Also included in: Grade 3 NEW Ontario Math Curriculum Full Year Digital Slides Bundle
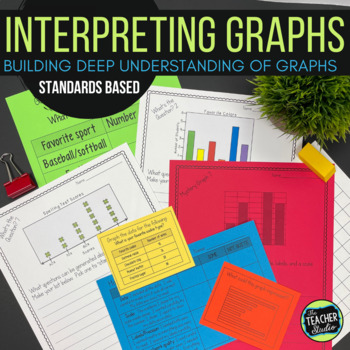
Graphs and Interpreting Graphs Activities - Hands On Data Investigations
What IS this graphing resource? These are NOT your typical graphing activities...and they are not just "busy work" for students--these graphing lessons are meant to be collaborative, instructional, rigorous, and FUN! Students need to have experience creating and interpreting graphs, so we need graphing lessons that are more than fill-in-the-blank worksheets. That's how we get students to understand that data has a purpose and that graphs show that data well.This resource includes opportunities
Showing 1-24 of 972 results


